This page contains step-by-step tutorial that will teach you how to digitize graph using luminosity recognition method in Graph Digitizer Scout software.
First download, install and run Graph Digitizer Scout
This tutorial will show step by step how to digitize graph on the picture using luminosity recognition method
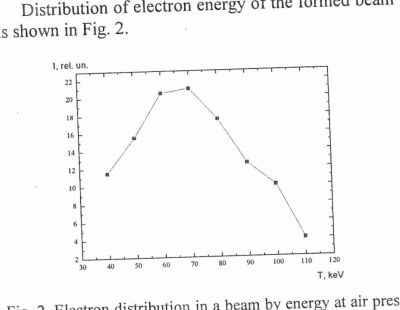
In this example we will digitize the following picture scanned from a journal:
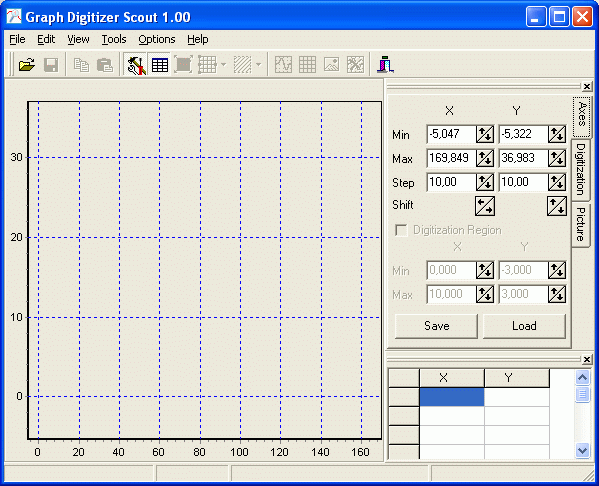
Run Graph Digitizer Scout:
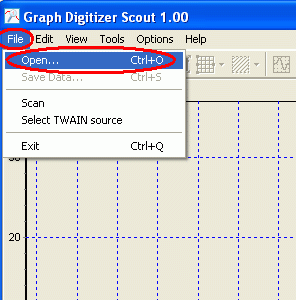
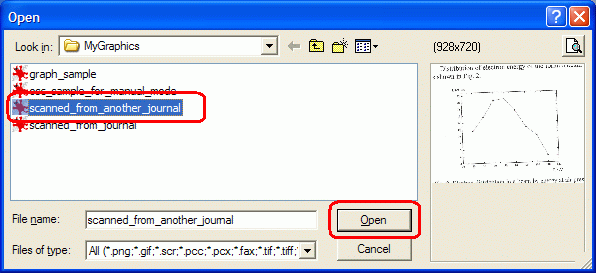
Open file with the scanned picture (you can also directly scan picture from Graph Digitizer Scout):
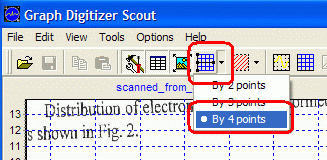
Now use “Coordinates Binding” tool to bind graph to 4 points so program will properly recognize X and Y coordinates without additional rotation of the image. Click on tool button and select By 4 Points mode:
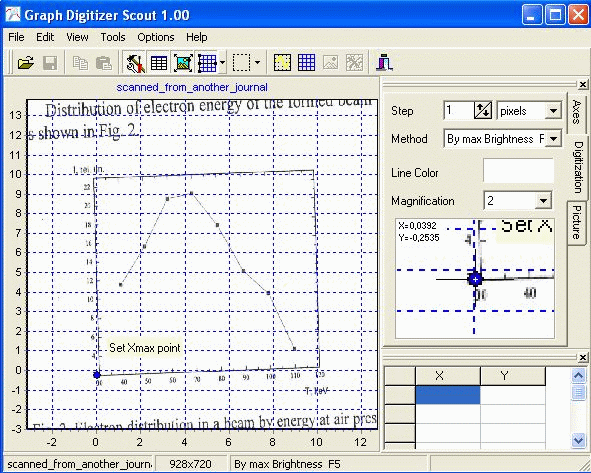
Now click on this points to set them: minX, maxX, minY, maxY
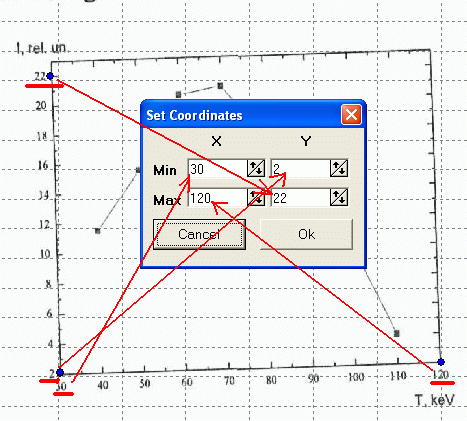
After you’ve pointed all 4 base points, the program will show Set Coordinates confirmation window.
Enter coordinates of Xmin, Xmax, Ymin, Ymax points as you see them on the original picture.
Click OK
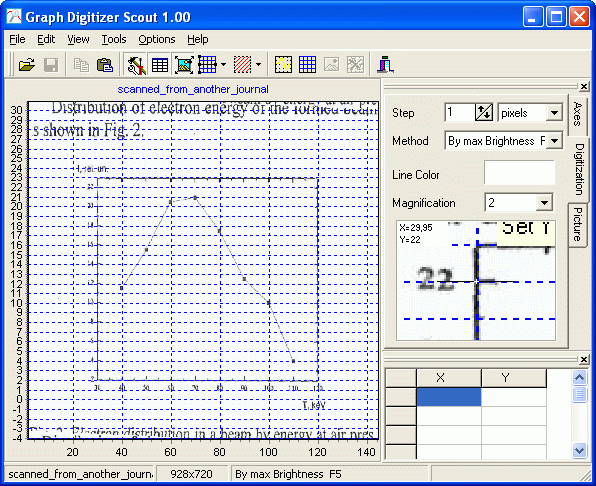
Program will rotate picture automatically according to base points:
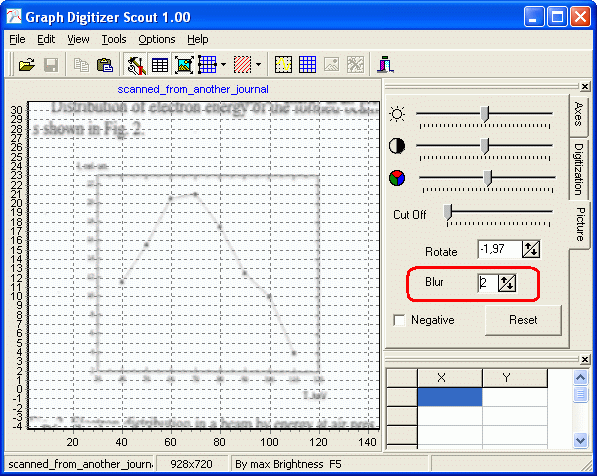
Then we should apply blur effect graph the picture for better graph recognition. Change Blur on Picture tab to 2:
Now we should set digitization region. Use Set Digitization Region tool button.
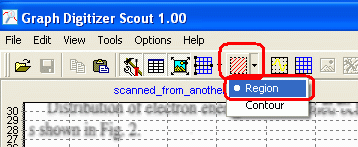
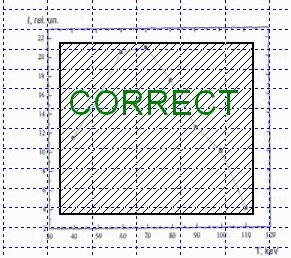
Select Region option and click button and select rectangle region using mouse
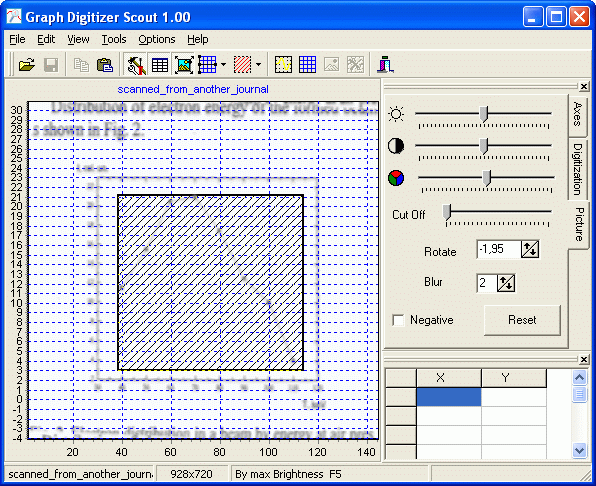
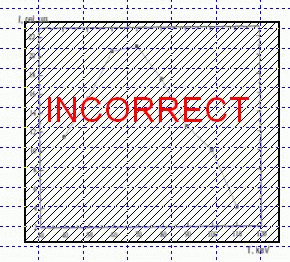
IMPORTANT: set minimum region and try to set graph only without original grid on the source picture.
As we are going to use luminosity recognition method so we should invert picture colors by checking “Negative” parameter on Picture tab:
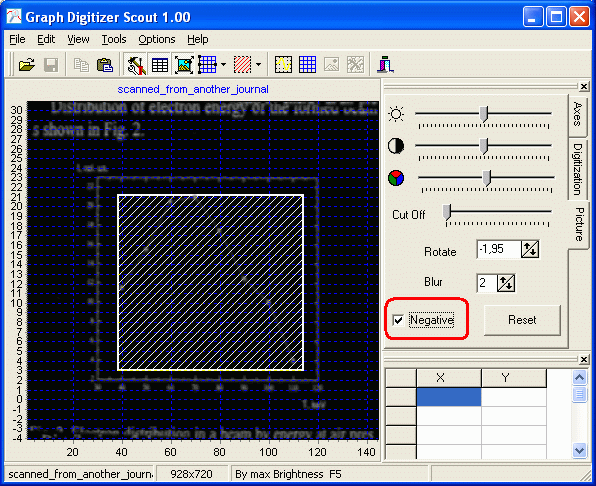
Set recognition method to By Max Brightness by pressing F5
Then press F9 to digitize graph:
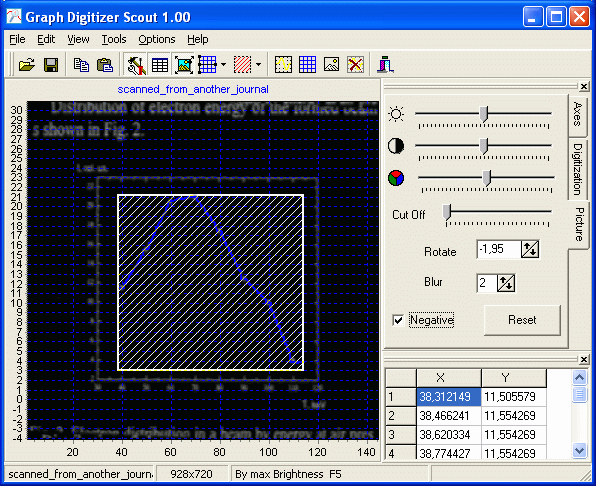
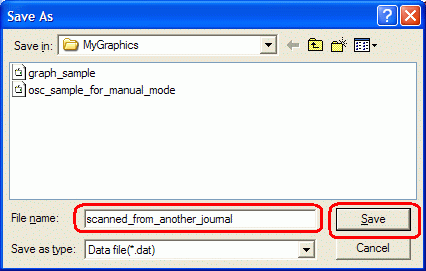
Save generated data to the file when correction is done:
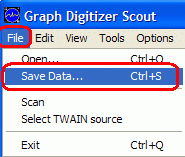
Select folder and filename to save data:
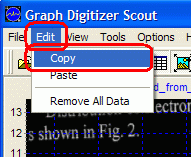
You can also simply copy this data to the clipboard for use in MS Excel:
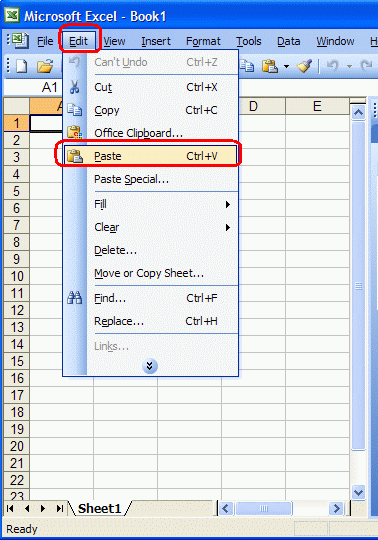
In Excel use Edit | Paste to insert data from clipboard:
Points coordinates pasted to the worksheet:
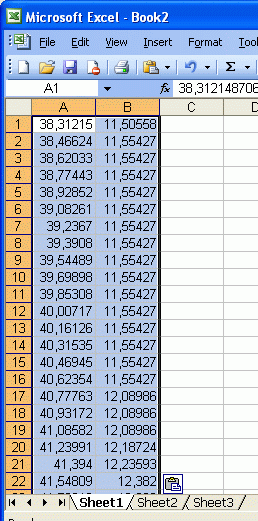
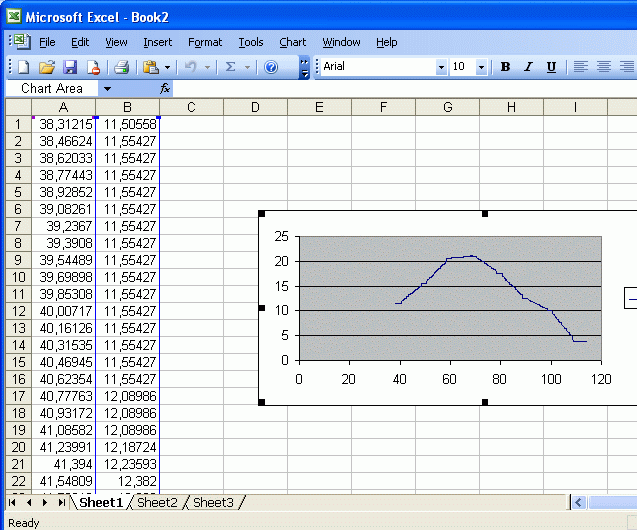
Then you you can create a chart using pasted data (A column in Excel contains X coordinates, B column in Excel contains Y coordinates)
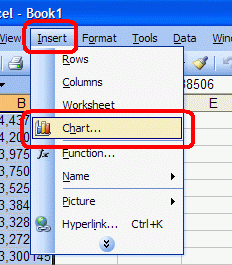
To add a chart just use Chart command in the Insert menu:
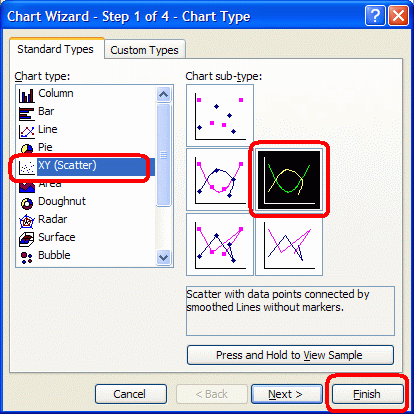
For example select XY chart type and click OK
Excel will add a chart to the worksheet:
You can also paste data to Mathlab.