This page contains step-by-step tutorial that will teach you how to digitize graph using color recognition method using Graph Digitizer Scout software.
First download, install and run Graph Digitizer Scout
This tutorial will show step by step how to digitize graph on the picture using built-in color selection tool
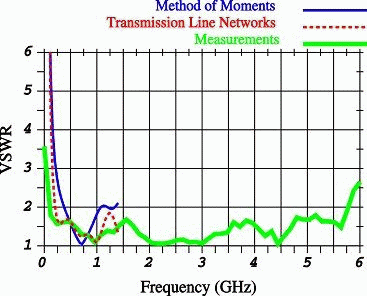
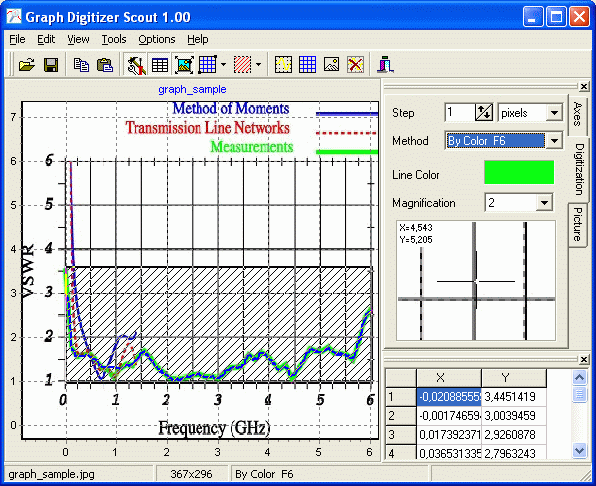
In this example we will digitize green graph from the following picture:
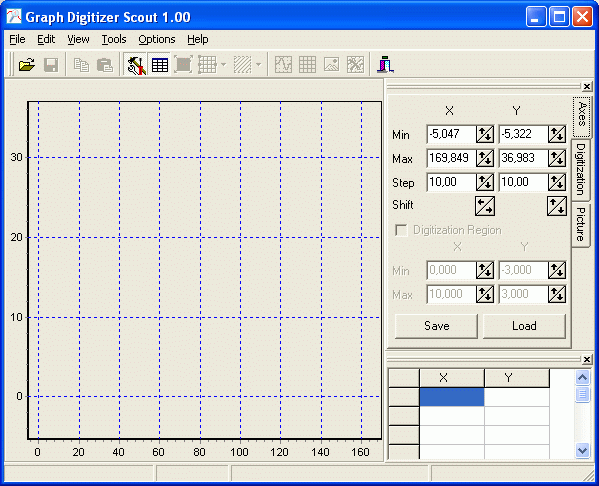
Run Graph Digitizer Scout:
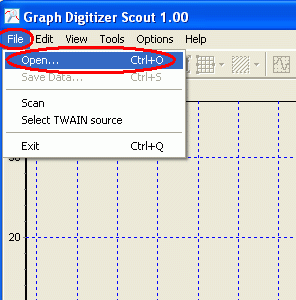
Now open picture file. To open picture use Open command in File menu:
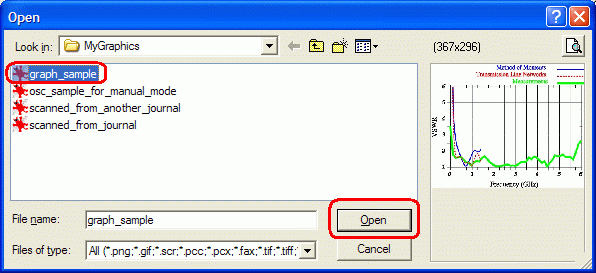
Select file with picture and click Open to open picture
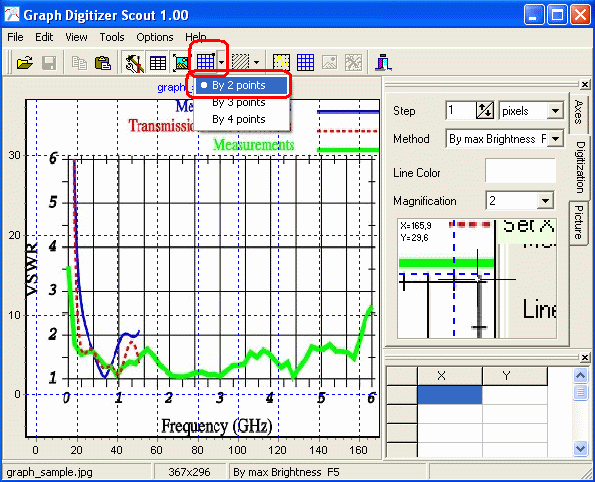
We will bind coordinates to 2 points. To bind graph by 2 points click on toolbar on Binding tool and select “By 2 Points”. In this mode we should set XminYmin and XmaxYmax points so program will use these point to bind graph to the grid
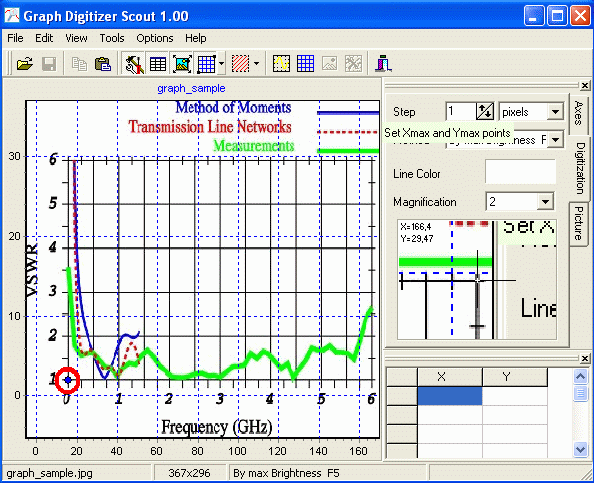
Now click on Xmin and Ymin point (left-bottom point of the coordinate scale):
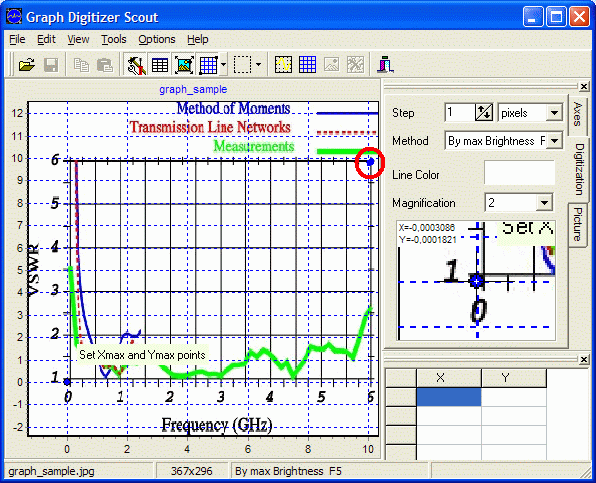
And then click on Xmax and Ymax point (bottom-top point):
Now program will display coordinates window to confirm coordinates.
Take a look at the picture and enter min and max values for X and Y axes:
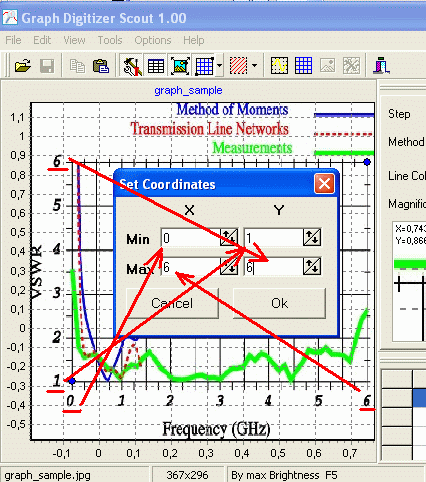
Then click OK
Graph Digitizer Scout will set grid relative to the original graph:
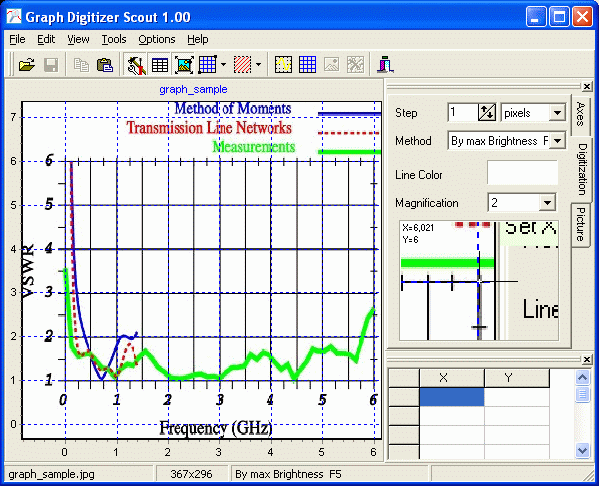
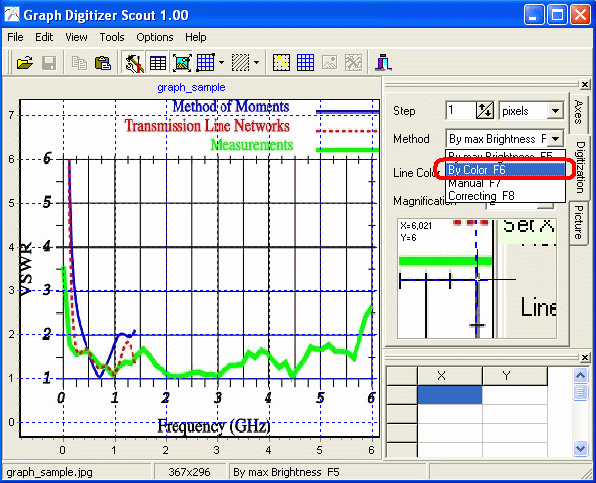
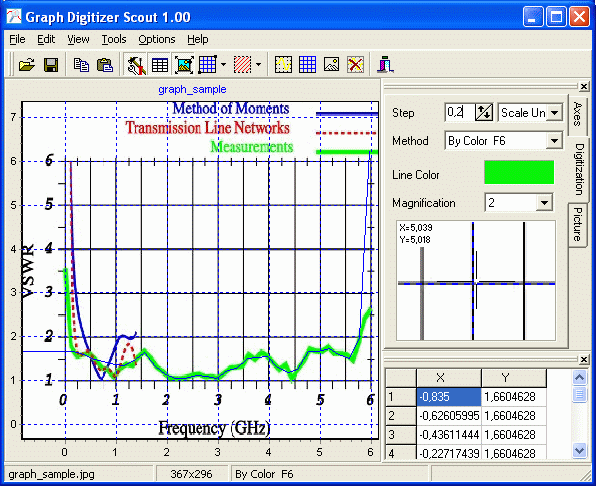
Now select Digitization tab on the vertical toolbar at the right.
And set digitization method to By Color F6 so program will digitize graph using color recognition method:
Now point out which graph on the picture we should recognize. To do this double-click on green graph and program will use green color to recognize source graph:
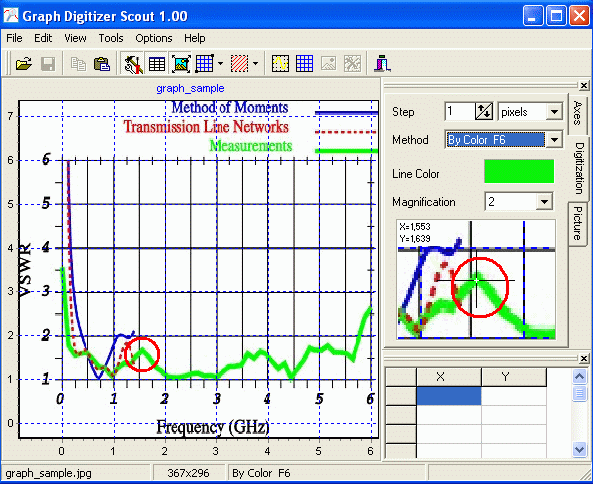
Now you see that Line Color indicator indicates green color as we’ve selected
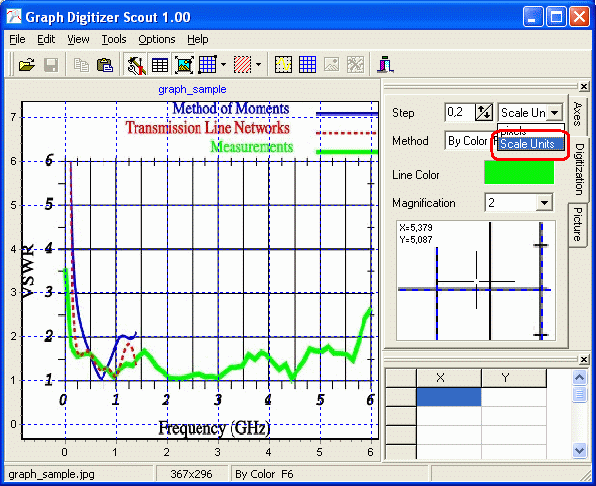
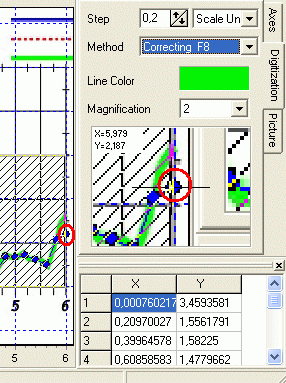
Now set digitization pitch in Step box to Scale Units
And set digitization step to 0.02 to get more more accurate recognition
Press F9 to start automatic digitization.
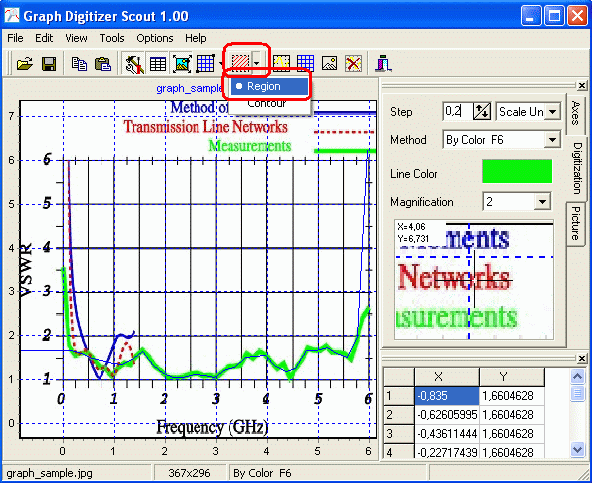
Program digitized green graph with blue graph but we see that we have to limit digitization region to get rid of noise outside graph.
So change Digitization Region on the main toolbar and set it to Region mode:
Then click on the Set Digitization Region button to start selection:
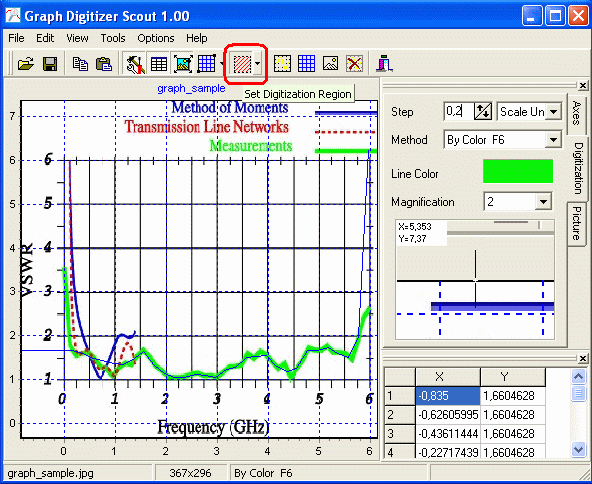
Click on the XminYmin point, hold on mouse button and set digitization region:
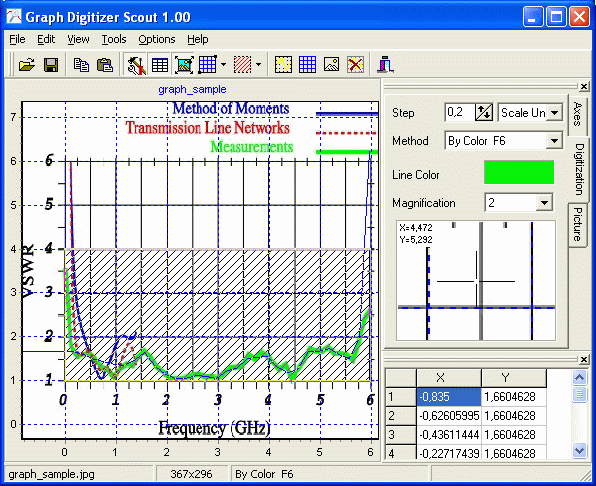
Then press F9 again to re-digitize selected region
Now we got this graph:
Much better!
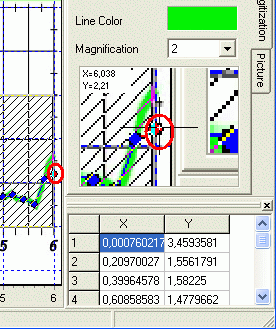
If we need to correct graph then we can do this in Correcting (F8) mode. We will correct last point of this graph:
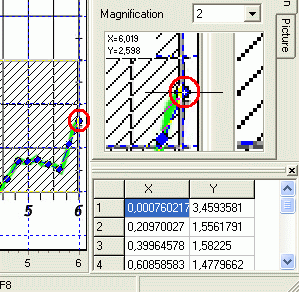
Left-click using mouse to select point (selected pointed will be highlighted with red color):
Now click on another position to move the point:
You can copy data from recognized graph to clipboard to move it to another application.
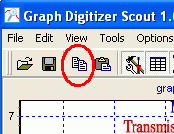
Click on Copy Data toolbar button to copy set of points coordinates to the clipboard:
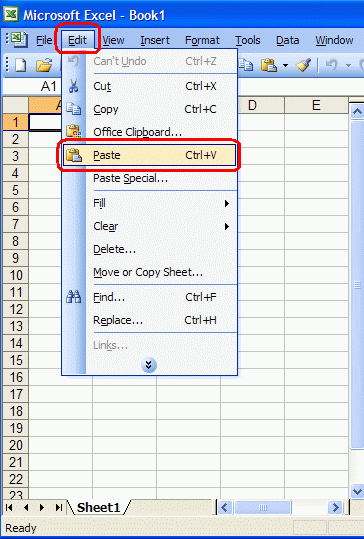
Now we can insert this set to the Excel
Run Ms Excel and select Paste command in Edit menu
Excel will insert set of points from clipboard to the worksheet:
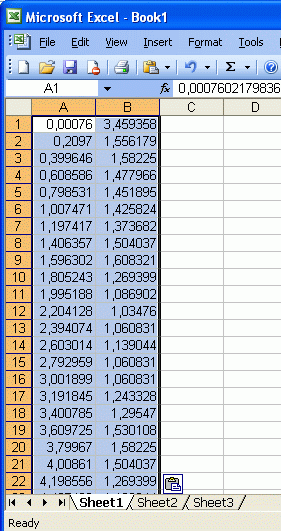
Now we can build a chart using inserted data (A column in Excel contains X coordinates, B column in Excel contains Y coordinates)
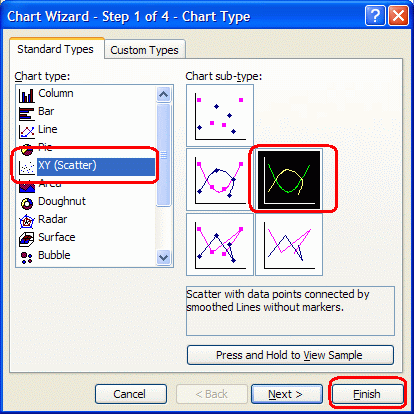
To build a chart select Chart command in Insert menu:
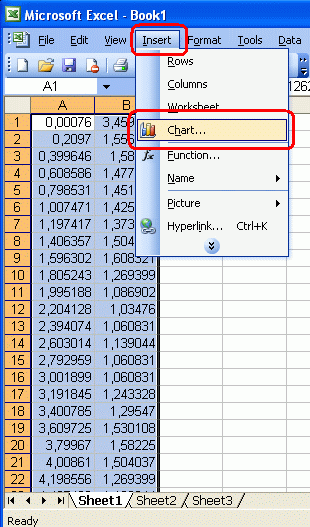
Chart Wizard will appear. Select XY (Scatter) chart type in Chart Wizard and click Finish
Excel will build a chart from our data:
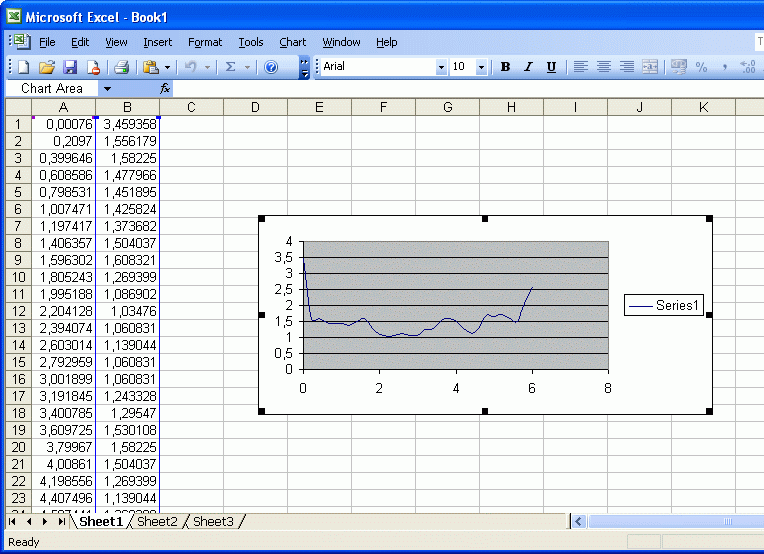
That’s all!