Our ByteScout SDK products are sunsetting as we focus on expanding new solutions.
Learn More
Important Update
ByteScout SDK Sunsetting Notice
Our ByteScout SDK products are sunsetting as we focus on our new & improved solutions.Thank you for being part of our journey, and we look forward to supporting you in this next chapter!
Creating, Formatting excel with various options using Bytescout Spreadsheet SDK in C# – Part 2
Creating, Formatting excel with various options using Bytescout Spreadsheet SDK in C# – Part 2
This is the second part of a series of articles on formatting and manipulating the Excel file using ByteScout Spreadsheet SDK. Many organizations rely on Microsoft Excel for the day-to-day activities of their business like data analysis, sales projections, reporting, etc. So before we go ahead, if you haven’t studied the previous parts of this article, I would highly recommend to read it now. You can get part 1 of this article here.
This article aims to give an introduction to some more advanced features provided by ByteScout Spreadsheet SDK on formatting / manipulating the excel by writing a step-by-step program in C#. We will talk about the following:
* Steps to create an Excel file by adding different type of bar charts in C#:
In many industries, bar charts are a standard way to visualize things. It summarizes a large amount of data in a visual and easily interpretable form. Even the most important statistics can look dull when written down in text. Bar charts use vertical or horizontal bars to represent data along both an x-axis and a y-axis visually. Each bar represents one value.
ByteScout Spreadsheet SDK provides a super easy method to implement a bar chart, pie chart, etc. To understand the bar chart easily, we will implement one company’s financial quarterly report. ByteScout Spreadsheet SDK provides a total of six types of bar charts.
Bar Clustered
Bar Stacked
Bar Stacked100
Bar Clustered3D
Bar Stacked3D
Bar Stacked1003D
So in this example, we have 5 columns. The first column represents “Financial Year” and the next 4 columns represent their quarterly revenue report.
Let’s write the program step-by-step to see how we can represent this report using a bar chart in Excel.
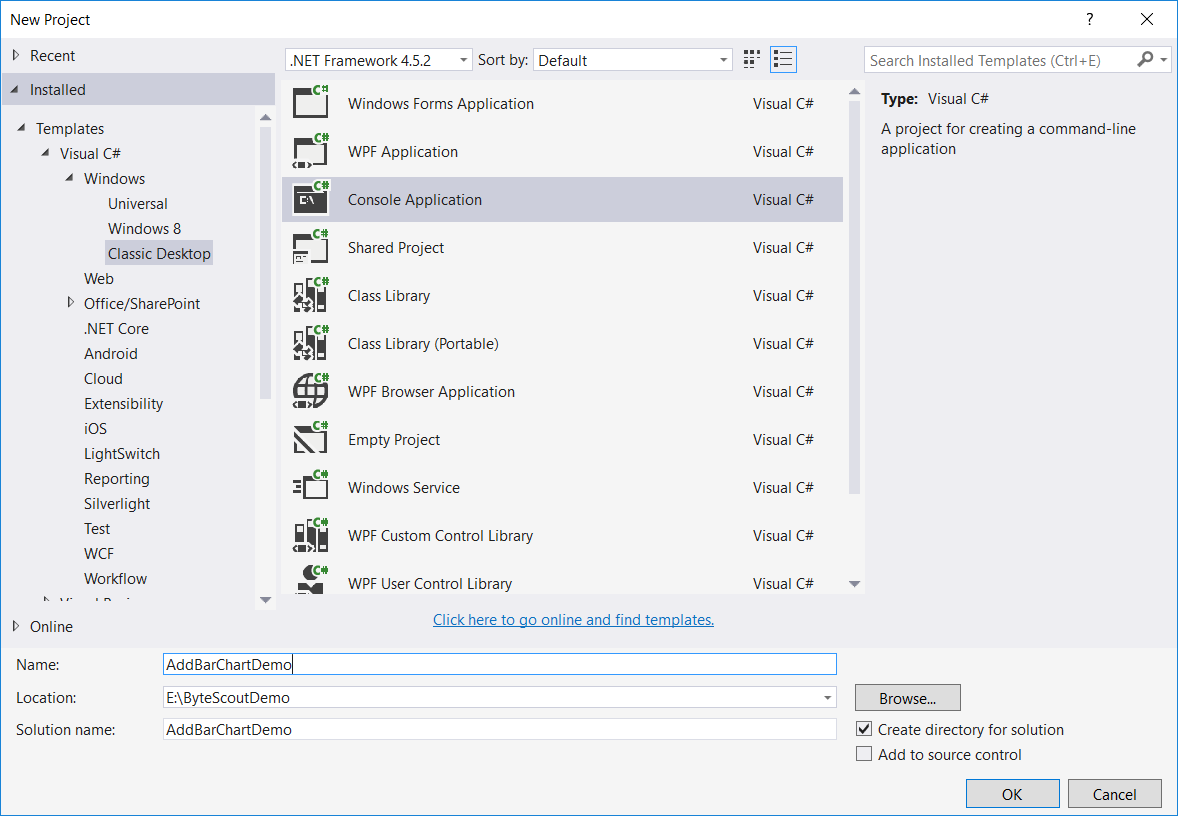
Step-1: Create a new C# console application project.
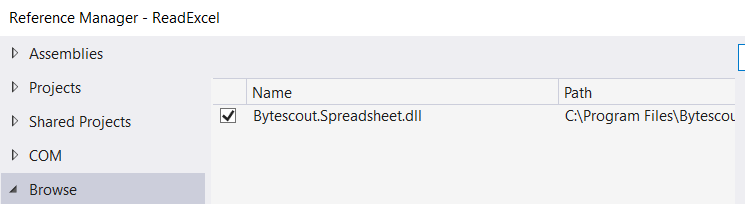
Step-2: Then add Bytescout.Spreadsheet.dll file as a reference to your project.
Step-3: Include the following namespaces in the Program.cs file.
using System. Diagnostics; using System. Drawing; using System.IO; using Bytescout.Spreadsheet; using Bytescout.Spreadsheet.Charts;
Step-4: Add the following code snippet.
	class Program
	{
		static void Main(string[] args)
		{
			// Create new Spreadsheet
			using (Spreadsheet document = new Spreadsheet())
			{
				Worksheet sheet = document.Workbook.Worksheets.Add("Sheet1");

				// Define required columns
				sheet.Cell(0, 0).Value = "Financial Year";
				sheet.Cell(0, 1).Value = "Quarter 1 Revenue (In Cror)";
				sheet.Cell(0, 2).Value = "Quarter 2 Revenue (In Cror)";
				sheet.Cell(0, 3).Value = "Quarter 3 Revenue (In Cror)";
				sheet.Cell(0, 4).Value = "Quarter 4 Revenue (In Cror)";

				// Fill the required data
				int length = 7, year = 2;
				Random rnd = new Random();
				for (int i = 1; i < length; i++)
				{
					sheet.Cell(i, 0).Value = string.Concat("201", year, " - ", "201", ++year);
					sheet.Cell(i, 1).Value = rnd.Next(500, 1100);
					sheet.Cell(i, 2).Value = rnd.Next(300, 900);
					sheet.Cell(i, 3).Value = rnd.Next(400, 1000);
					sheet.Cell(i, 4).Value = rnd.Next(400, 800);
				}

				sheet.Columns[0].AutoFit();

				// Add charts to worksheet
				Chart barChart = sheet.Charts.AddChartAndFitInto(8, 0, 23, 6, ChartType.BarClustered);
				SetBarChartRange(barChart, sheet, length);

				barChart = sheet.Charts.AddChartAndFitInto(8, 8, 23, 14, ChartType.BarStacked);
				SetBarChartRange(barChart, sheet, length);

				barChart = sheet.Charts.AddChartAndFitInto(8, 16, 23, 22, ChartType.BarStacked100);
				SetBarChartRange(barChart, sheet, length);

				barChart = sheet.Charts.AddChartAndFitInto(26, 0, 44, 6, ChartType.BarClustered3D);
				SetBarChartRange(barChart, sheet, length);

				barChart = sheet.Charts.AddChartAndFitInto(26, 8, 44, 14, ChartType.BarStacked3D);
				SetBarChartRange(barChart, sheet, length);

				barChart = sheet.Charts.AddChartAndFitInto(26, 16, 44, 22, ChartType.BarStacked1003D);
				SetBarChartRange(barChart, sheet, length);

				if (File.Exists("BarChartDemo.xls"))
					File.Delete("BarChartDemo.xls");

				// Save it as XLS
				document.SaveAs("BarChartDemo.xls");

				//Close Spreadsheet
				document.Close();

				// Open generated XLS document
				Process.Start("BarChartDemo.xls");
			}
		}

		private static void SetBarChartRange(Chart barChart, Worksheet sheet, int length)
		{
			barChart.SeriesCollection.Add(new Series(sheet.Range(1, 1, length - 1, 1)));
			barChart.SeriesCollection.Add(new Series(sheet.Range(1, 2, length - 1, 2)));
			barChart.SeriesCollection.Add(new Series(sheet.Range(1, 3, length - 1, 3)));
			barChart.SeriesCollection.Add(new Series(sheet.Range(1, 4, length - 1, 4)));
		}
	}
Now let’s see this program in action:
Let’s understand the above code step by step.
Here first we define the required columns and generate some dummy data using the following code.
// Define required columns sheet.Cell(0, 0).Value = "Financial Year"; sheet.Cell(0, 1).Value = "Quarter 1 Revenue (In Cror)"; sheet.Cell(0, 2).Value = "Quarter 2 Revenue (In Cror)"; sheet.Cell(0, 3).Value = "Quarter 3 Revenue (In Cror)"; sheet.Cell(0, 4).Value = "Quarter 4 Revenue (In Cror)"; // Fill the required data int length = 7, year = 2; Random rnd = new Random(); for (int i = 1; i < length; i++) { sheet.Cell(i, 0).Value = string.Concat("201", year, " - ", "201", ++year); sheet.Cell(i, 1).Value = rnd.Next(500, 1100); sheet.Cell(i, 2).Value = rnd.Next(300, 900); sheet.Cell(i, 3).Value = rnd.Next(400, 1000); sheet.Cell(i, 4).Value = rnd.Next(400, 800); }
And then, in the same way, we add further other types of bar charts like bar stacked, bar clustered3D, etc. using the above-mentioned code.
And then we check if the same file name already exists in the application’s bin\Debug folder. If exists then first delete it.
// delete file if exists already if (File.Exists("BarChartDemo.xls")){ File.Delete("BarChartDemo.xls"); }
And then we generate a file.
// Save document document.SaveAs("BarChartDemo.xls");
Steps to create an Excel file by adding different type of pie chart in C#:
Charts give us a simple way to visualize statistical information. The pie chart is one such tool. It has a circular shape and shows data in slices. Pie Charts help to show percentages between categories, by dividing a circle into proportional segments. ByteScout Spreadsheet SDK provides a total of six types of pie charts.
Pie
Pie3D
PieOfPie
Pie Exploded
Pie Exploded3D
BarOfPie
In this program, we will use the same example as mentioned in the above bar chart example. Let’s create an application now.
Step-1: Create a new C# console application project.
Step-2: Then add Bytescout.Spreadsheet.dll file as a reference to your project.
Step-3: Include the following namespaces in the Program.cs file.
using System.Diagnostics; using System.IO; using Bytescout.Spreadsheet; using Bytescout.Spreadsheet.Charts;
Step-4: Add the following code snippet.
class Program
{
static void Main(string[] args)
{
// Create new Spreadsheet
using (Spreadsheet document = new Spreadsheet())
{
// Add new worksheet
Worksheet sheet = document.Workbook.Worksheets.Add(&amp;quot;Sheet1&amp;quot;);
// Make two column
sheet.Cell(0, 0).Value = &amp;quot;Financial Year&amp;quot;;
sheet.Cell(0, 1).Value = &amp;quot;Company's Revenue (In Cror)&amp;quot;;
// Add few random numbers
int length = 7, year = 2;
Random rnd = new Random();
for (int i = 1; i &amp;lt; length; i++)
{
sheet.Cell(i, 0).Value = string.Concat(&amp;quot;201&amp;quot;, year, &amp;quot; - &amp;quot;, &amp;quot;201&amp;quot;, ++year);
sheet.Cell(i, 1).Value = rnd.Next(500, 1100);
}
sheet.Columns[0].AutoFit();
// add charts to worksheet
Chart pieChart = sheet.Charts.AddChartAndFitInto(8, 0, 23, 6, ChartType.Pie);
pieChart.SeriesCollection.Add(new Series(sheet.Range(1, 1, length - 1, 1)));
pieChart = sheet.Charts.AddChartAndFitInto(8, 8, 23, 14, ChartType.Pie3D);
pieChart.SeriesCollection.Add(new Series(sheet.Range(1, 1, length - 1, 1)));
pieChart = sheet.Charts.AddChartAndFitInto(8, 16, 23, 22, ChartType.PieOfPie);
pieChart.SeriesCollection.Add(new Series(sheet.Range(1, 1, length - 1, 1)));
pieChart = sheet.Charts.AddChartAndFitInto(26, 0, 44, 6, ChartType.PieExploded);
pieChart.SeriesCollection.Add(new Series(sheet.Range(1, 1, length - 1, 1)));
pieChart = sheet.Charts.AddChartAndFitInto(26, 8, 44, 14, ChartType.PieExploded3D);
pieChart.SeriesCollection.Add(new Series(sheet.Range(1, 1, length - 1, 1)));
pieChart = sheet.Charts.AddChartAndFitInto(26, 16, 44, 22, ChartType.BarOfPie);
pieChart.SeriesCollection.Add(new Series(sheet.Range(1, 1, length - 1, 1)));
if (File.Exists(&amp;quot;PieChartDemo.xls&amp;quot;))
File.Delete(&amp;quot;PieChartDemo.xls&amp;quot;);
// Save document
document.SaveAs(&amp;quot;PieChartDemo.xls&amp;quot;);
//Close Spreadsheet
document.Close();
// Open generated XLS document
Process.Start(&amp;quot;PieChartDemo.xls&amp;quot;);
}
}
}
If you run the application, the final Excel file will look like this:
* Steps to create an Excel file with background image in it in C#:
Generally, most of us have seen Excel with a white plain background. However, for some custom requirements, we need to background image like kind of watermark to it. This can be easily achieved using ByteScout Spreadsheet SDK. In this program, we will add our own background image in Excel worksheet.
Step-1: Create a new C# console application project as shown in the first demo program.
Step-2: Then add Bytescout.Spreadsheet.dll file as a reference to your project.
Step-3: Include the following namespaces in the Program.cs file.
using System.Drawing; using System.Diagnostics; using System.IO; using Bytescout.Spreadsheet;
Step-4: Add the following code snippet.
	class Program
	{
		static void Main(string[] args)
		{
			// Create new Spreadsheet
			using (Spreadsheet document = new Spreadsheet())
			{
				Worksheet worksheet = document.Workbook.Worksheets.Add("Sheet1");

				// Make two column
				worksheet.Cell(3, 0).Value = "Product Name";
				worksheet.Cell(3, 1).Value = "Price";
				// Set column header style
				worksheet.Cell(3, 0).Font = new Font("Verdana", 14, FontStyle.Bold);
				worksheet.Cell(3, 1).Font = new Font("Verdana", 14, FontStyle.Bold);

				// Write product name
				worksheet.Cell(4, 0).Value = "Refrigerator";
				worksheet.Cell(5, 0).Value = "TV";
				worksheet.Cell(4, 1).Value = 1000;
				worksheet.Cell(5, 1).Value = 600;

				// Put background image on the worksheet
				worksheet.BackgroundPicture = Image.FromFile("green-grass-background.jpg");

				if (File.Exists("BackgroundImageDemo.xls"))
					File.Delete("BackgroundImageDemo.xls");

				// Save document
				document.SaveAs("BackgroundImageDemo.xls");

				//Close Spreadsheet
				document.Close();

				// Open generated XLS document
				Process.Start("BackgroundImageDemo.xls");
			}
		}
	}
And here’s the demo in action.
Here first we have added some data in Excel and then we set background image using the following code.
// Put background image on the worksheet worksheet.BackgroundPicture = Image.FromFile("green-grass-background.jpg");
* Steps to create an Excel file by Copy-Paste Column/Rows in C#:
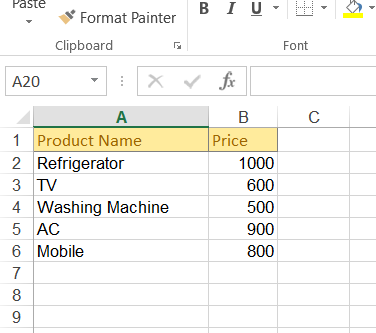
When you copy rows and columns, Excel will copies all data that they contain, including formulas and their resulting values, comments, cell formats, and hidden cells. In this program, we will see how to create an excel file by copying some rows/columns programmatically from the existing file. Suppose, we have an Excel file which looks like this:
and you want to copy second column (“B”) to the fifth (“F”) column and first column (“A”) to the sixth (“G”) column.
Step-1: Create a new C# console application project.
Step-2: Then add Bytescout.Spreadsheet.dll file as a reference to your project.
Step-3: Include the following namespaces in the Program.cs file.
using System.Diagnostics; using System.IO; using Bytescout.Spreadsheet;
Step-4: Add the following code snippet.
	class Program
	{
		static void Main(string[] args)
		{
			// Create new Spreadsheet
			using (Spreadsheet document = new Spreadsheet())
			{
				document.LoadFromFile(@"SourceExcel.xls");

				// Get first worksheet
				Worksheet worksheet = document.Workbook.Worksheets[0];

				// copy 4th and 5th no# of rows at 7th row position.
				worksheet.Rows.CopyAndPaste(4, 5, 7);

				// Copy Second column ("B") to the fifth ("F") column
				worksheet.Columns.CopyAndPaste(1, 1, 5);
				// Copy first column ("A") to the sixth ("G") column
				worksheet.Columns.CopyAndPaste(0, 0, 6);

				if (File.Exists("CopiedExcelDemo.xls"))
					File.Delete("CopiedExcelDemo.xls");

				// Save document
				document.SaveAs("CopiedExcelDemo.xls");

				//Close Spreadsheet
				document.Close();

				// Open generated XLS document
				Process.Start("CopiedExcelDemo.xls");
			}
		}
	}
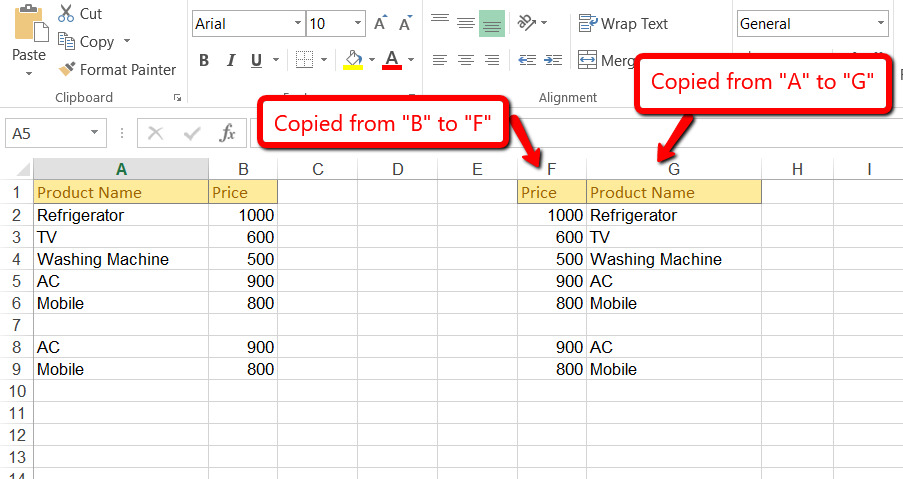
If you run the application, the final excel file will look like this:
And here is the demo application in action:
As you can see in the above code snippet that we have copied 4th and 5th no# of rows at 7th-row position using the following code.
// copy 4th and 5th no# of rows at 7th-row position. worksheet.Rows.CopyAndPaste(4, 5, 7);
and then we copied second column (“B”) to the fifth (“F”) and first column (“A”) to the sixth column (“G”)
// Copy Second column ("B") to the fifth ("F") column worksheet.Columns.CopyAndPaste(1, 1, 5);
// Copy first column ("A") to the sixth ("G") column worksheet.Columns.CopyAndPaste(0, 0, 6);
* Steps to create an Excel file by Copy Worksheet in C#:
Copying a sheet of data from one worksheet to another programmatically sounds like a complicated job. For this task, ByteScout Spreadsheet SDK has a built-in method to achieve this requirement. Suppose, you have a range of data in Sheet 1 with so many formulas in it, and now you want to copy the whole from Sheet 1 to Sheet 2.
Let’s write the program step-by-step.
Step-1: Create a new C# console application project.
Step-2: Then add Bytescout.Spreadsheet.dll file as a reference to your project.
Step-3: Include the following namespaces in the Program.cs file.
using System.Diagnostics; using System.IO; using Bytescout.Spreadsheet;
Step-4: Add the following code snippet.
	class Program
	{
		static void Main(string[] args)
		{
			using (Spreadsheet document = new Spreadsheet())
			{
				document.LoadFromFile("SourceExcel.xls");

				// Create copy of worksheet
				document.Workbook.Worksheets.Copy(0, 1, "Copied From Sheet1");

				if (File.Exists("CopiedWorksheetDemo.xls"))
					File.Delete("CopiedWorksheetDemo.xls");

				// Save document
				document.SaveAs("CopiedWorksheetDemo.xls");

				//Close Spreadsheet
				document.Close();

				// Open generated XLS document
				Process.Start("CopiedWorksheetDemo.xls");
			}
		}
	}
If you run the application, the final Excel file will look like this:
* Steps to create an Excel file by Copy Range in C#:
Consider you have a large worksheet, and now you only want to copy some selected ranges data and paste it to some selected cells in the same worksheet. In this program, we will be going to see how we can programmatically copy some selected ranges of data from the existing excel file.
Step-1: Create a new C# console application project.
Step-2: Then add Bytescout.Spreadsheet.dll file as a reference to your project.
Step-3: Include the following namespaces in the Program.cs file.
using System.Diagnostics; using System.IO; using Bytescout.Spreadsheet;
Step-4: Add the following code snippet.
	class Program
	{
		static void Main(string[] args)
		{
			// Create new Spreadsheet
			using (Spreadsheet document = new Spreadsheet())
			{
				document.LoadFromFile(@"SourceExcel.xls");

				// Get the worksheet
				Worksheet worksheet = document.Workbook.Worksheets[0];

				// Select cell range
				var range = worksheet.Range("A1:A5");

				// Copy range to A8 cell
				range.CopyInto("A8");

				if (File.Exists("RangeCopiedDemo.xls"))
					File.Delete("RangeCopiedDemo.xls");

				// Save document
				document.SaveAs("RangeCopiedDemo.xls");

				//Close Spreadsheet
				document.Close();

				// Open generated XLS document
				Process.Start("RangeCopiedDemo.xls");
			}
		}
	}
If you run the application, the final Excel file will look like this:
In summary, we explored six different types of features to format and manipulate excel using ByteScout Spreadsheet SDK and we will explore some more features in the next article. Till then stay tuned and stay updated with us.
Happy Coding 🙂
About the Author
ByteScout Team of WritersByteScout has a team of professional writers proficient in different technical topics. We select the best writers to cover interesting and trending topics for our readers. We love developers and we hope our articles help you learn about programming and programmers.