Our ByteScout SDK products are sunsetting as we focus on expanding new solutions.
Learn More
Important Update
ByteScout SDK Sunsetting Notice
Our ByteScout SDK products are sunsetting as we focus on our new & improved solutions.Thank you for being part of our journey, and we look forward to supporting you in this next chapter!
Dimensionality Reduction Using Principal Component Analysis (PCA)
Dimensionality Reduction Using Principal Component Analysis (PCA)
In data analysis, dimensionality reduction in the form of transformation changes the data from a higher dimension to a lower dimension. Computer scientists use this technique to avoid the curse of dimensionality. The curse of dimensionality means the challenges occur while working with predictive modeling if there are many input features. Hence, reducing the number of input variables eases the working of the model on the provided dataset.
In a dataset, the total number of features determines the dimensionality of it. Having a massive number of features in a dataset often reduces the performance of machine learning algorithms. In machine learning, having a large feature space which is n-dimensional and considering rows of data as points in the space usually form a small and non-representative sample. When the model tries to fit over many features, it causes low-performance issues and raises the need for feature reduction.
In machine learning and other such fields, the developers use the dimensionality reduction technique to make a simple model by avoiding overfitting a model and making it reusable for a different data set. This kind of model generalizes well and shows better performance on the provided dataset. There is a close relationship between the number of input features and the degree of freedom in linear models. Therefore, it performs well with linear models as well.
Techniques Used for Dimensionality Reduction
There are a lot of improvised techniques in use for reducing features from a dataset. In all the techniques, the algorithms try to find efficient results in the lower dimensions, representing the higher dimensions’ original data.
Out of so many advanced techniques, the original seven methods of dimensionality reduction are the following:
Missing Values Ratio
Low Variance Filter
High Correlation Filter
Random Forest/ Ensemble Trees
Principal Component Analysis (PCA)
Backward Feature Elimination
Forward Feature Elimination
Principal Component Analysis
Principal Component Analysis (PCA) is one of the classical approaches to find the optimal linear transformations. In 1901, Pearson introduced this method. Later in 1933, Hotelling also used this method to illustrate the variation in multivariate data set regarding a set of uncorrelated variables.
Principal component analysis (PCA) is a data reduction method used to emphasize variation and identify healthy patterns in any given dataset. The developers mostly use this technique to make data easy to explore and visualize. Moreover, PCA is useful for eliminating dimensions for the data, which is in the higher dimension and hard to visualize.
PCA Approach
PCA method tries to preserve as much information as possible in the given data while reducing its dimensions. Therefore, it looks for the projection that represents the data best in the least square sense.
All PCA does is rotate the axes, so the new coordinate system aligns with maximum variability in data. It usually discards components that do not contribute significantly to describe the original data. Furthermore, it removes dimensions from the rotated space without affecting the remaining components’ relationship, describing a lower-dimensional orthonormal basis. Hence the resulting space is still linear but with fewer dimensions.
Assumptions
These are the assumptions used in performing this method:
The variance of the features carries the information meaning that the higher the variance in one dimension, the higher the information carried by that feature.
Transformation tends to use the least number of dimensions while preserving the most variance in the given data.
It projects the data onto the lower-dimensional space where the new features best represent the old features in the least square sense.
Error minimization in PCA
When the data goes through the reduction methods, it loses some information based on how much the dimensionality is reduced. Although each method works to preserve the useful information in the data, PCA works best to preserve information as much as possible. In this way, it minimizes the errors introduced by the change in the data.
Error = ||x-x^||
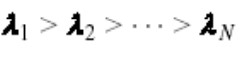
To achieve this, PCA determines the best lower-dimensional space by the data’s covariance matrix’s best eigenvectors. The variance helps to find the eigenvectors. Also, the best eigenvectors correspond to the largest eigenvalues. These eigenvalues are known as principal components. In the case of PCA, eigenvalues decide how much information the users want to lose. Additionally, the higher eigenvalues contain more information, so the users want to save those eigenvalues to preserve the full details in most cases.
Steps to perform PCA
These are the steps to perform PCA on some input data:
Suppose x1, x2, x3, x4,…, xM are N X 1 vectors.
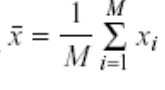
Compute the mean of the vectors.
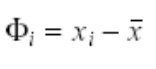
Subtract the mean from the individual vectors.
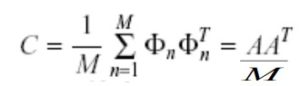
Form a N X M matrix A.
Use A to compute covariance matrix C.
Compute the eigenvectors of C.
Compute the eigenvalues of C.
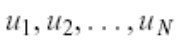
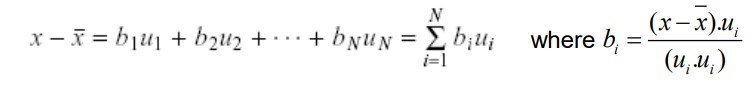
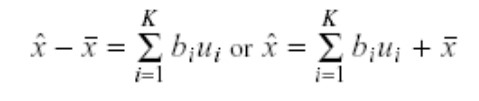
Since the computed C matrix is symmetric, the eigenvalues u1, u2, u3, u4,.., uN form a basis. In other words, the users can write any vector x as a linear combination of the eigenvectors.
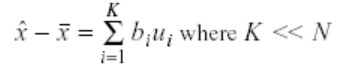
Keep only the terms that correspond to the K largest eigenvalues.
How to choose an appropriate value for K?
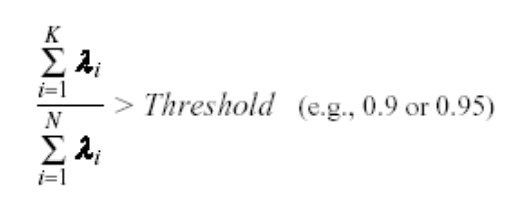
In the PCA method, K’s value plays a significant role in the reduction because it controls the number of chosen eigenvalues. These eigenvalues, in turn, control the dimensionality reduction. Therefore, it is crucial to select the appropriate value of K that preserves the necessary information in the data, and that is why there is a definite criterion to choose it:
If the threshold is 0.9 or 0.95, the user wants to preserve 90% or 95% of the input data’s information. In the scenario where K = N, the user preserves 100% of the data’s information.
Error due to Dimensionality Reduction
The PCA algorithm reduces the dimensionality using the principal components, and the users can also reconstruct the original vector x using those principal components. The equation for reconstruction is:
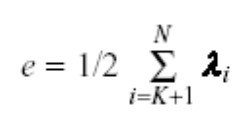
The users can reconstruct the original vector using the above equation. However, some reconstructed error is associated with it because of losing some information while reducing dimensionality. Following is the equation to calculate the error of reconstruction:
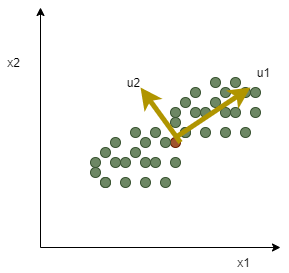
Geometric Interpretation
The eigenvalues’ magnitude corresponds to the data’s variance along with the eigenvector directions from the geometrical standpoint. In drawing the graph, the eigenvectors represent principle axes along which data, or in other words, covariance matrix, show the most considerable variance. The principle components or the eigenvalues are the weight coefficients in the graph.
Programming Example
In programming, the users can write a PCA algorithm using the above PCA steps. However, in Python, few libraries provide the inbuilt PCA function, such as sklearn. Below is an example of the PCA function in Python using sklearn.

import numpy as np
from sklearn.decomposition import PCA
T = np.array([[-1, -1], [-2, -1], [-3, -2], [1, 1], [2, 1], [3, 2]])
pca = PCA (n_components =2)                     ##n_components: no. of components to keep
pca.transform(T)                                #applying dimensionality reduction on data T
Note: the users can read more about this function and its various parameters in the sklearn documentation.
About the Author
ByteScout Team of WritersByteScout has a team of professional writers proficient in different technical topics. We select the best writers to cover interesting and trending topics for our readers. We love developers and we hope our articles help you learn about programming and programmers.
SQL ist unglaublich mächtig und wie jedes gut gemachte Entwicklungstool verfügt es über ein paar Befehle, über die jeder gute Entwickler Bescheid wissen sollte. Hier sind...
'Poly' means many, and 'morphism' means forms. Hence, Polymorphism represents "many forms," which arises when several classes are connected by inheritance. Polymorphism uses the same...