Our ByteScout SDK products are sunsetting as we focus on expanding new solutions.
Learn More
Important Update
ByteScout SDK Sunsetting Notice
Our ByteScout SDK products are sunsetting as we focus on our new & improved solutions.Thank you for being part of our journey, and we look forward to supporting you in this next chapter!
Detecting Fake Currency Notes Via Machine Learning
Detecting Fake Currency Notes Via Machine Learning
This article explains how to detect fake currency notes via machine learning using the Python Scikit-learn library. Depending upon different features of a currency note, the machine learning model developed in this article is able to predict whether or not a currency note is fake.
Execute the following script in a Python editor of your choice to import the classes and modules from the libraries that you just downloaded.
import pandas as pd
import numpy as np
from sklearn.linear_model import LogisticRegression
from sklearn.model_selection import train_test_split
from sklearn.metrics import accuracy_score
import matplotlib.pyplot as plt
%matplotlib inline
Importing the Dataset
Machine learning models learn from the dataset. The dataset contains features and output labels. Machine learning models learn the relationship between features and output labels. The dataset that you are going to use to train the machine learning model is available freely here.
The dataset contains information about images of banknotes and corresponding labels that denotes whether banknotes are fake or not. The features available for a banknote image are variance, skewness, kurtosis, and entropy. The label has two possibilities: 0 or 1, where 0 stands for an original note and 1 denotes a fake note.
The read_csv() method of the Pandas library can be used to import the CSV file that contains the dataset as shown in the following script. The following script also prints the first five rows of the dataset using the head() method.
Output:
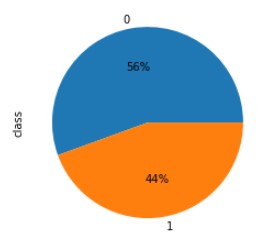
The above pie chart shows that 56% of the currency notes are genuine while the rest of 44% of currency notes are fake.
Divide Data into Features and Labels
Since machine learning models find a relationship between features and labels, we need to split our dataset into feature sets and label sets. The class attribute represents the label in the dataset. Therefore, to create a feature set we remove the class attribute, and to create the label set we filter the class attribute and remove all the remaining attributes. In the following script variable X contains features and variable y contains labels.
#divide data into features and label set
X = dataset.drop(["class"], axis = 1)
y = dataset.filter(["class"], axis = 1)
Divide Data into Training and Test Sets
The following script divides the dataset into a 75% training set and a 25% test set. Machine learning models are trained on the training set while the performance of the machine learning model is evaluated on the test set.
from sklearn.model_selection import train_test_split
X_train, X_test, y_train, y_test = train_test_split(X, y,  test_size=0.25, random_state=42)
Feature Scaling
Before a machine learning model is actually trained, it is a very good practice to scale the features so that all the attributes have feature values within the same range. The StandardScaler class from the sklearn.preprocessing module can be used for feature scaling as shown in the following script.
#applying scaling on training and test data
from sklearn.preprocessing import StandardScaler
scaler = StandardScaler()
X_train = scaler.fit_transform(X_train)
X_test = scaler.transform (X_test)
Training Machine Learning Model and Making Predictions
Once the data is divided into training and test set and has been scaled, you are ready to train your machine learning models. Several machine learning algorithms exist in the Python Scikit Learn library which you can use to train machine learning models for the classification models. A complete list is available at this link. You can use any classification model from this link. In this article, you will use the Logistic Regression algorithm. To train a model, you have to pass the training features and labels to the fit() method of the LogisticRegression class object as shown in the following script. To make predictions on the test set, you can use the predict() method.
#importing logistic regression model
from sklearn.linear_model import LogisticRegression

#training the logistic regression model
classifier = LogisticRegression()
classifier.fit(X_train, y_train)

#making predicions on test set
y_pred = classifier.predict(X_test)
Finding Model Accuracy
To see how well your machine learning performs on the test set, the final step is to evaluate your model performance. To do so, you can use accuracy as a metric. Accuracy divides the number of correct predictions made by your model by the total number of records in the test set. To find accuracy, you can pass the actual labels and the predicted labels to the accuracy_score() method of the sklearn.metrics module. This is shown in the following script:
print(accuracy_score(y_test, y_pred))
Output:
0.9795918367346939
The output above shows that our model performance is 97.95% which means that our probability of our machine learning model for correctly predicting whether or not a bank is not fake is 97.95%. Impressive? No?
Making Prediction on a Single Bank Note
Let’s now see how you can make predictions on a single banknote instead of a complete test set. To make a prediction on an individual banknote, you need values for variance, skewness, kurtosis, and entropy of the image of the banknote. Let’s print the feature values for the 50th banknote in the dataset.
From the above output, we know that this banknote is not fake since the value of the class attribute is 0.
To find the label for the 50th note in the dataset using the trained machine learning model, you need to pass the information of the 50th note in the dataset to a standard scaler which scales your feature set. Next, you need to pass the scaled dataset to the predict() method of the model that you already trained. Look at the following script for reference.
single_record = scaler.transform (X.values[50].reshape(1, -1))

#making predictions on the single record
fake_note = classifier.predict(single_record)
print(fake_note)
Output:
[0]
The above output shows that our banknote is not fake which is the correct output.
About the Author
ByteScout Team of WritersByteScout has a team of professional writers proficient in different technical topics. We select the best writers to cover interesting and trending topics for our readers. We love developers and we hope our articles help you learn about programming and programmers.
Robots are everywhere these days. The world of computer science and technology is full of software robots and hardware robots which are responsible for bringing...