Our ByteScout SDK products are sunsetting as we focus on expanding new solutions.
Learn More
Important Update
ByteScout SDK Sunsetting Notice
Our ByteScout SDK products are sunsetting as we focus on our new & improved solutions.Thank you for being part of our journey, and we look forward to supporting you in this next chapter!
Debugging JavaScript code using Google Chrome Developer Tools
Debugging JavaScript code using Google Chrome Developer Tools
JavaScript is a client-side programming language that helps developers add interactivity to their web pages on the client-side. Since JavaScript runs within a client’s browser, it is extremely fast. Typically, JavaScript is typically used to perform client-side validations, add dynamic effects and perform animations.
In the inception stages of the World Wide Web, the browsers were not sophisticated enough and it was extremely cumbersome to debug JavaScript. However, with time, browsers evolved and JavaScript debugging features were added to the browser.
Google chrome also includes detailed debugging tools in the form of Developer tools. This tutorial explains the process of debugging JavaScript code with the help of these developer tools.
Before, dwelling into the details of debugging techniques, let us assume we have a webpage with the following script.
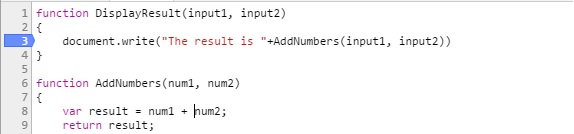
It can be seen in the Head of the webpage that the page links to a JavaScript file named “script.js”. Also, some JavaScript code has been added in the script tag which calls “DisplayResult”. Since the function is not defined in the webpage, it should be present in the “script.js” file. The contents of the “script.js” file are as follows:
function DisplayResult(input1, input2)
{
document.write("The result is "+AddNumbers(input1, input2))
}

function AddNumbers(num1, num2)
{
var result = num1 + num2;
return result;
}
It can be seen that the file contains two functions: The DisplayResult function which is called from the webpage and the AddNumbers function which takes two parameters, add them, and returns the result of the addition. AddNumbers function is being called from the DisplayResult function.
Now, let us see how we can debug a JavsScript program.
JavaScript Step by Step Debugging
There are two ways to launch Google chrome developer tools.
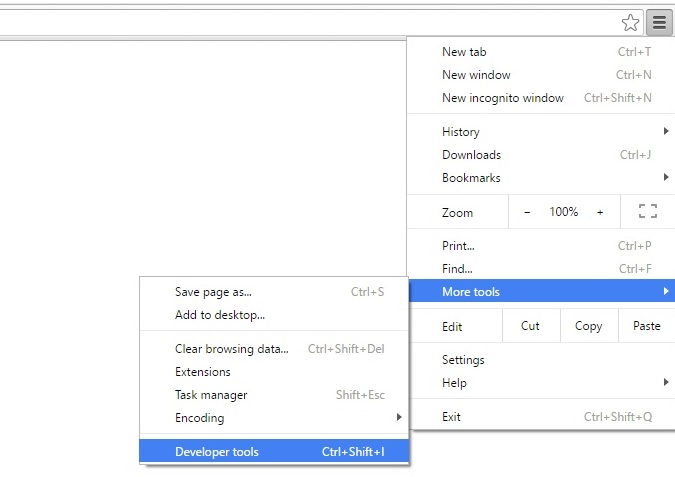
First is by going to the top-right corner of the browser window and clicking the “Customize and control Google Chrome” button. This opens a drop-down list. Select the “More tools” option from the list and then select the “Developer tools” from the drop-down list which appears. Have a look at the following figure:
The other way to launch Developer tools in chrome is by simply right-clicking anywhere on the page and click “Inspect” from the options that populate.
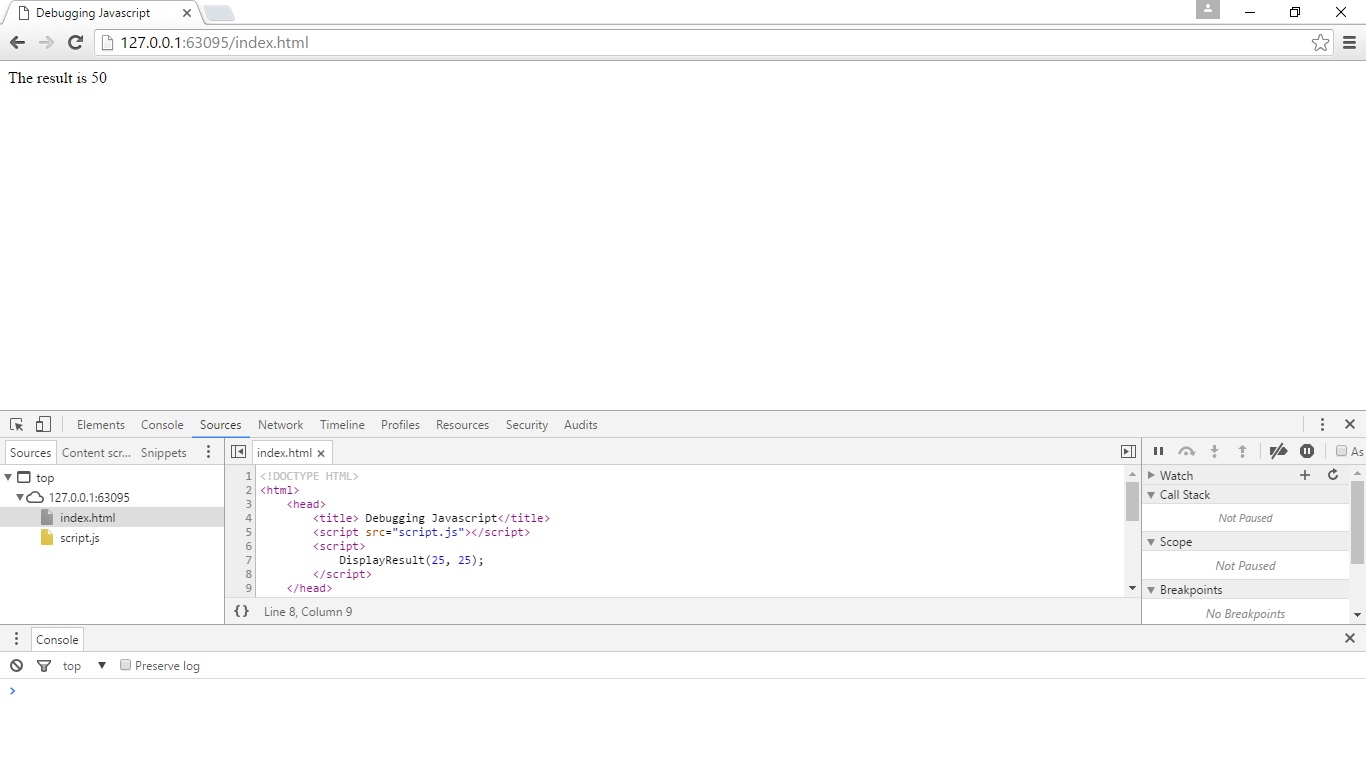
For this tutorial, we opened the webpage that we created at the start of the tutorial and then opened developer tools. The following window appears at the bottom of the screen.
You can see that there are several options. If you click “Sources” from the options, you can see your webpage and all the pages that it references. In our case both the “index.html” which is our only page is displayed along with the script that we are using. Click the “script.js” file and you will see its contents.
In case of any errors, the console window will display them. At the moment there is no error in our JavaScript file. Let us introduce an error. Change the AddNumbers function of the “script.js” file so that it looks like this:
function AddNumbers(num1, num2)
{
var result = num1 + number2;
return result;
}
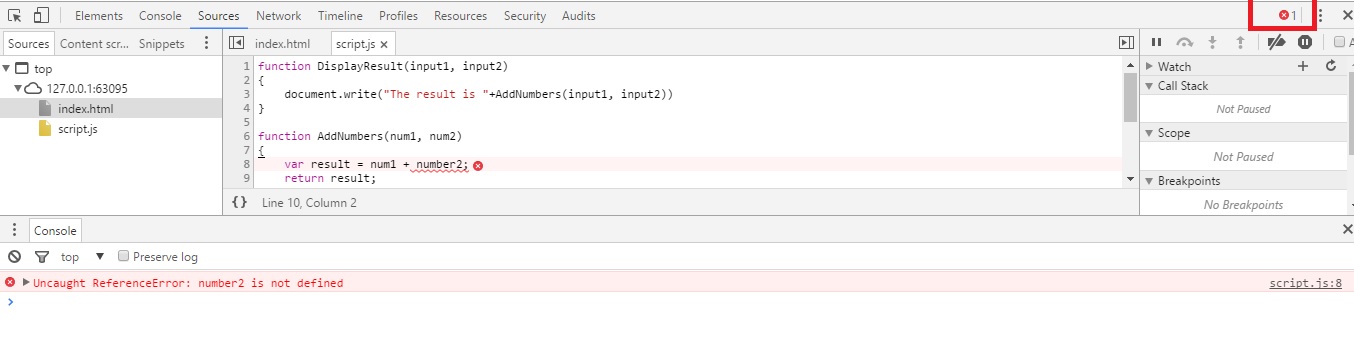
Note, we have changed num2 to number2 but this variable doesn’t exist. If you again open the webpage or refresh it via “Ctrl+R” and open the developer tools, you will see an error. Have a look at the following figure:
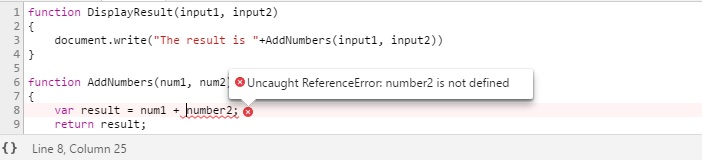
If you look at the top right of the above figure, you shall see an error icon with the number 1. This shows there is 1 error in the program. If you look at the console at the bottom, the error is shown. On the extreme right, the file which contains the error and the line number of the error is also shown which is the “script.js” file and line number 8. If you click this file, the contents of the file will be displayed. You can click the error icon to see the detail of the error as shown in the following figure:
Adding Break Points in Chrome Developer Tools
Breakpoints help stop the execution of your code at a certain point. Developers can view the state of a different variable at a certain point of execution with the help of these breakpoints. For instance, if you want to see what variables are passed to the “DisplayResult” function you can add a breakpoint at the start of that function. To add breakpoint simply click on the left grey area of the line at which you want your program to stop execution. The area will turn blue as shown in the following figure:
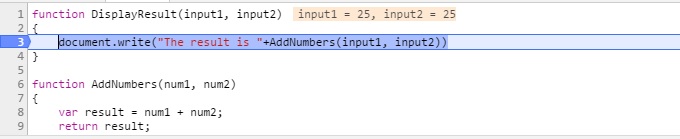
Now if you refresh the page using “Ctrl + R”, the page will stop its execution at the breakpoint which you set. This is shown in the following figure:
Here you can see the contents of variables input1 and input2. You can use the F10 key to step over the code, F11 to step into the code i.e. other functions, Shift + F11 to step out of code, and F8 to continue executing the code.
Conditional breakpoints can also be added which only hits if a certain condition is met. To do so, right-click on the grey area on the left side of the line where you want to add a breakpoint and select, “Add conditional breakpoint” option. A text field will appear. Here the condition can be added. For instance, you can add that if the value of the input1 is 20, only then this breakpoint should be hit.
Using Watch in JavaScript Developer Tools
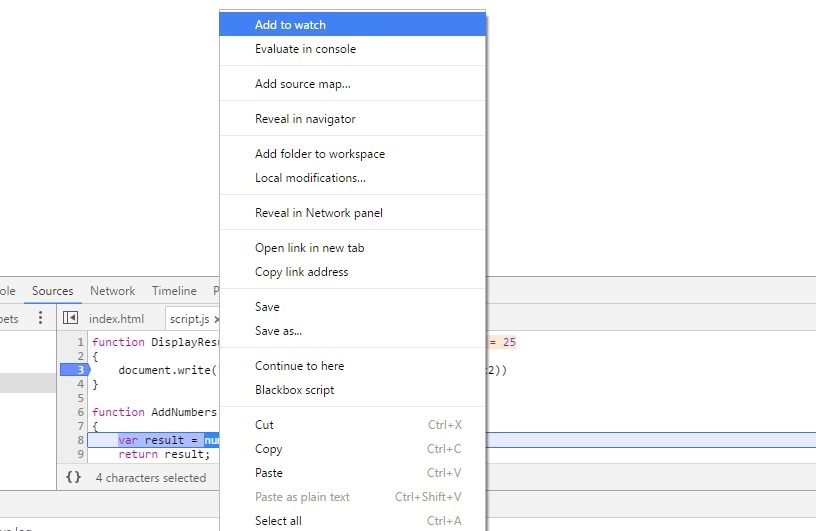
Chrome developer tools also let developers watch the behavior of a variable using the “Add Watch” feature. To add a feature to watch, simply Right-click the variable and select the “Add to watch” option that appears at the top of the list. Have a look at the following figure:
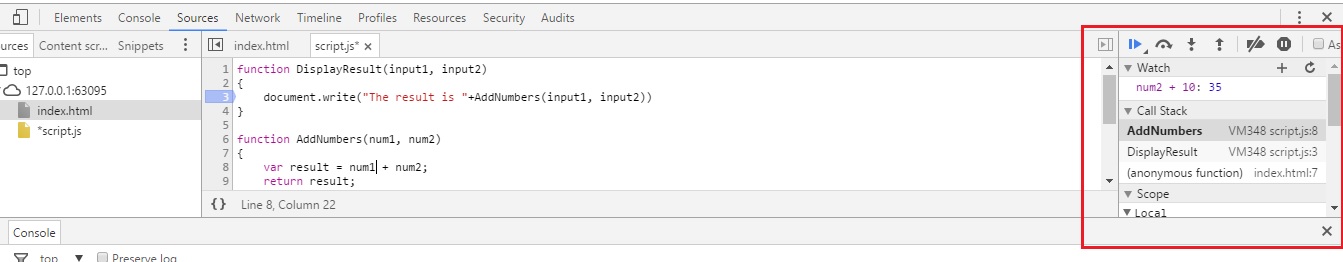
Once you add a variable to the watch it appears inside a window in the developer tools. You can do whatever you want with the variable. For instance, number ten has been added to the “num2” variable which is under the watch. The developer tools have evaluated the expression and the result has been displayed. Consider the following figure:
About the Author
ByteScout Team of WritersByteScout has a team of professional writers proficient in different technical topics. We select the best writers to cover interesting and trending topics for our readers. We love developers and we hope our articles help you learn about programming and programmers.
When the developer has built the desired application, the SDLC's next step is to deploy it for testing purposes. The process of delivering the application...
Wordpress became a dominant platform for websites. According to various analytics systems, more than 30% of active websites in the world are currently using Wordpress...