This page contains example of digitizing oscillogram from scanned hard-copy paper back to data using brightness recognition method in Graph Digitizer Scout software.
First download, install and run Graph Digitizer Scout
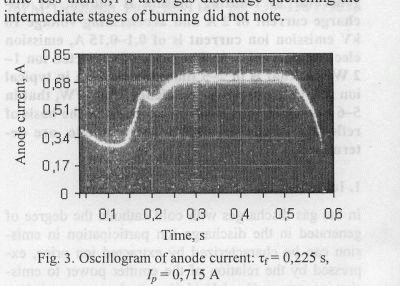
This tutorial describes how to use Graph Digitizer Scout to digitize oscillogram from a journal or book:
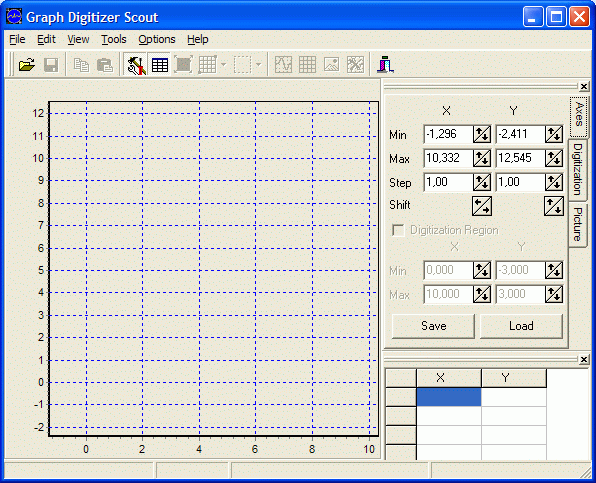
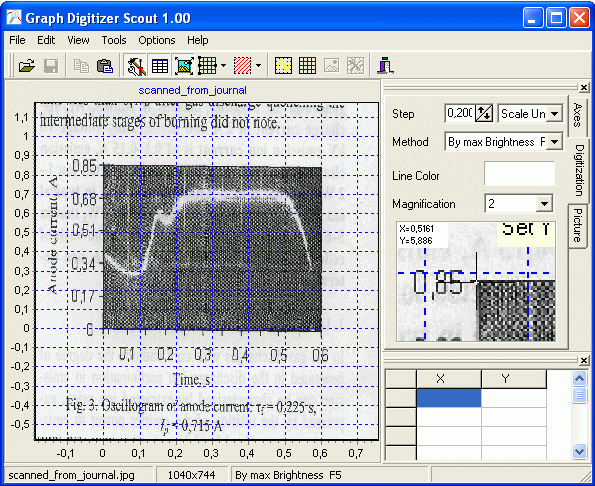
Run Graph Digitizer Scout:
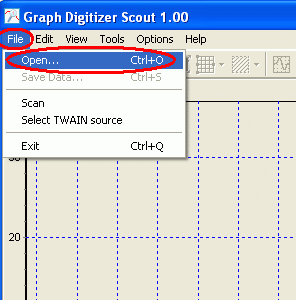
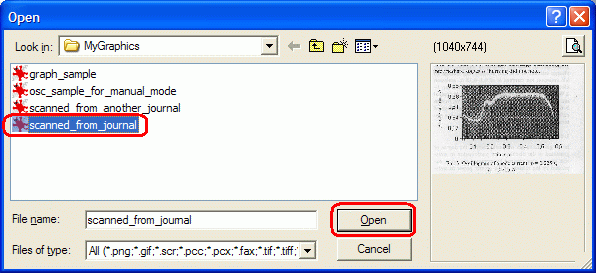
Open file with the scanned picture (you can also directly scan picture from Graph Digitizer Scout):
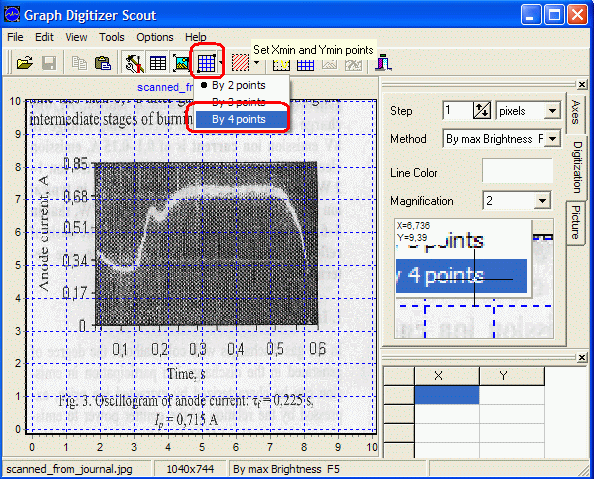
Use Binding Tool to bind graph to the coordinate grid. Use By 4 Points mode:
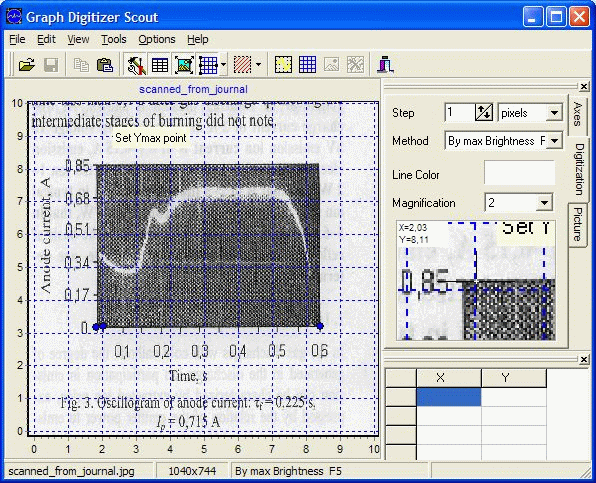
Set Xmin, Xmax, Ymin, Ymax points:
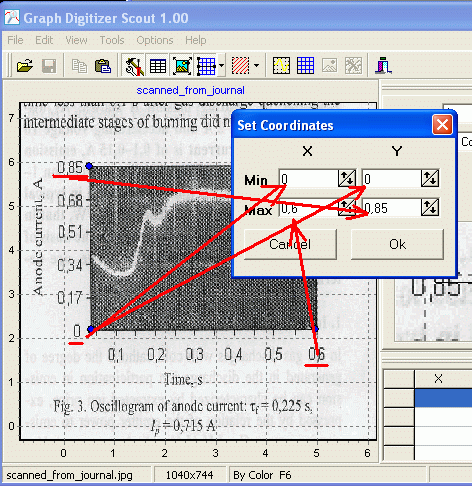
After you’ve clicked Ymax point, the program will ask to confirm and enter values that you can find on the original picture. Enter values of Xmin, Xmax, Ymin and Ymax you’ve pointed and click OK to confirm:
Now grid is corrected according to the original picture scale units:
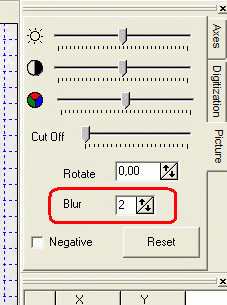
Set Blur for the picture to 2 for better recognition results:
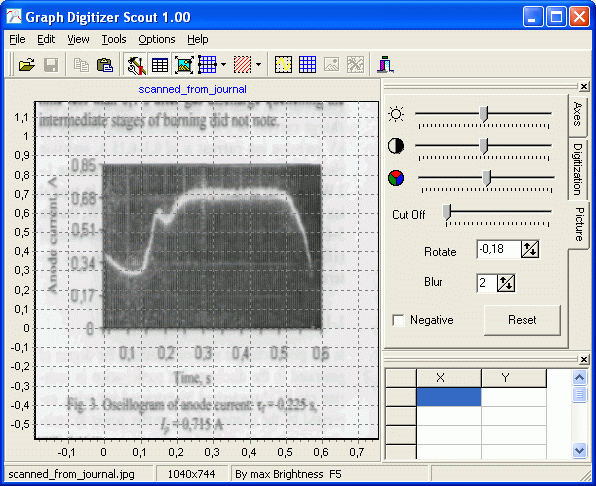
Blur applied to the picture:
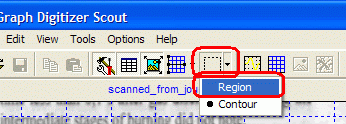
Now click Set Digitization Region tool and select Region mode:
Then select a region with oscillogram:
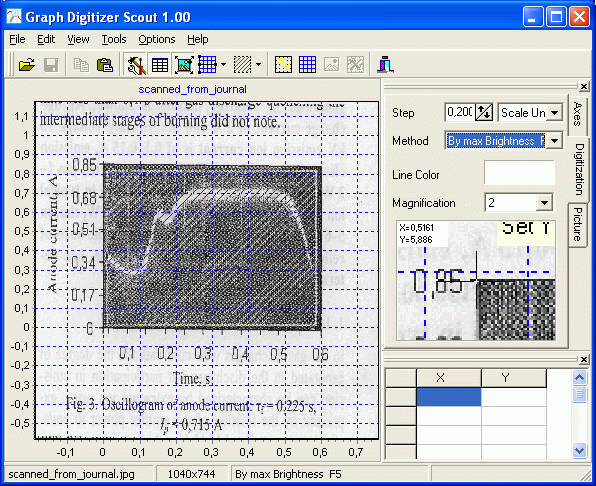
Set recognition mode to By Max Brightness by pressing F5
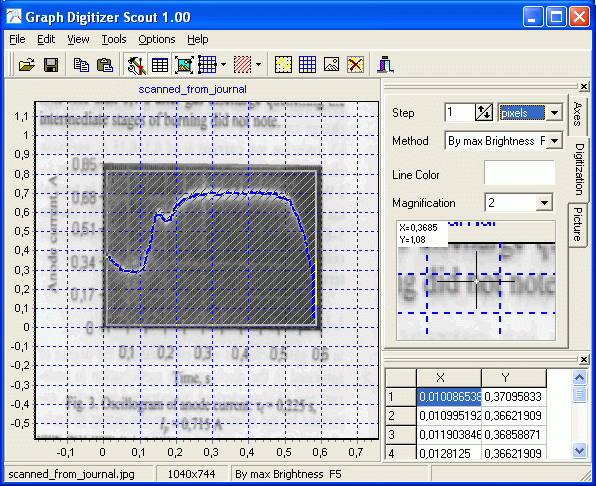
Press F9 on your keyboard to start digitization:
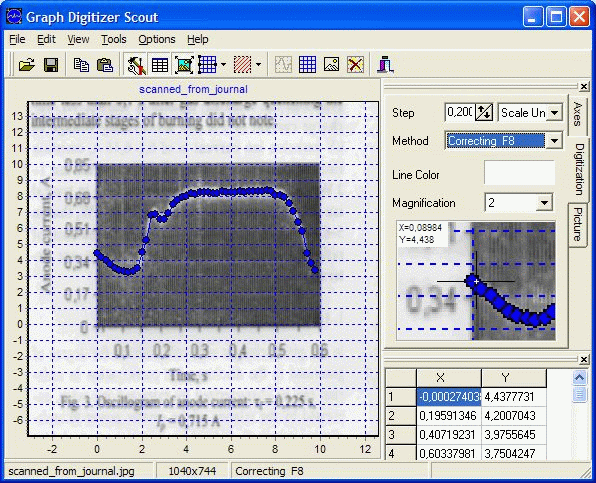
The program will recognize graph and place points for the oscillogram:
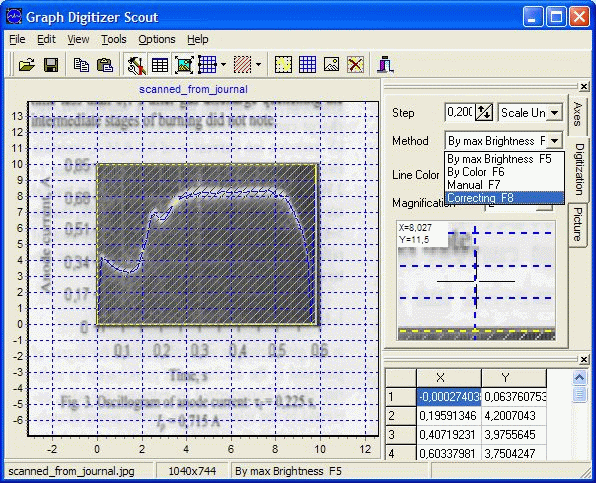
Correct points in Correcting Mode (press F8 to set Manual mode) if required:
Correcting some points – click on point using mouse:
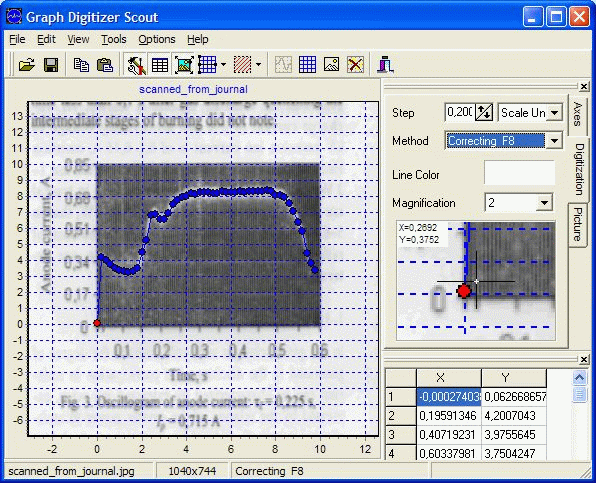
And then click new position for selected point:
Correction is done.
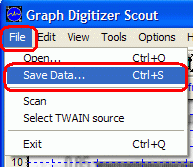
Save data to the file using File | Save Data…
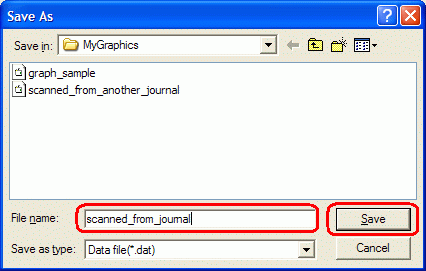
Enter filename and click Save
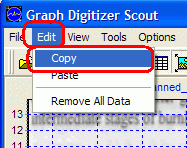
You can also copy data to the clipboard for use in another software, for example, Excel
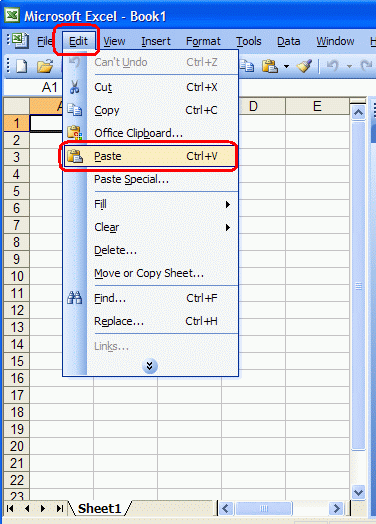
To copy data to the clipboard please use Edit menu and Copy command as shown below:
Now run Excel and use Paste command in Edit group to paste data from clipboard:
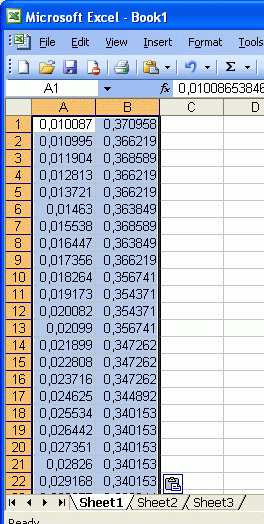
This will insert data to the Excel as 2 columns automatically:
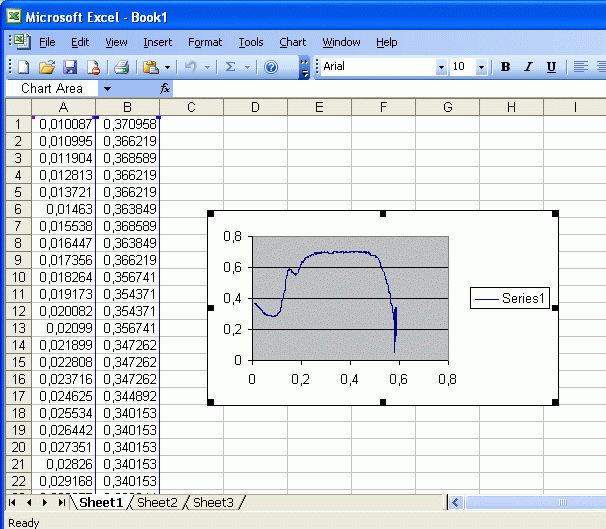
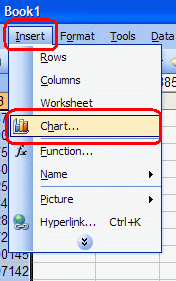
Now you can use it to generate a chart
Go to Insert menu and select Chart command:
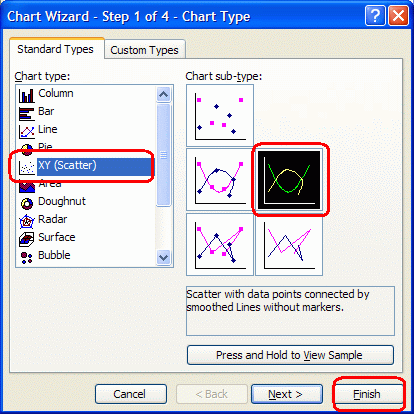
Select chart type for new chart and click Finish to insert chart:
Excel generates a chart based on data from oscillogram: