This example is a step-by-step tutorial showing how to digitize complex graph in manual mode with Graph Digitizer Scout software.
First download, install and run Graph Digitizer Scout
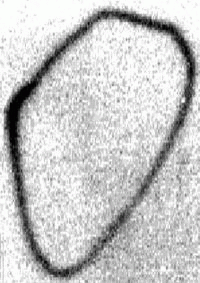
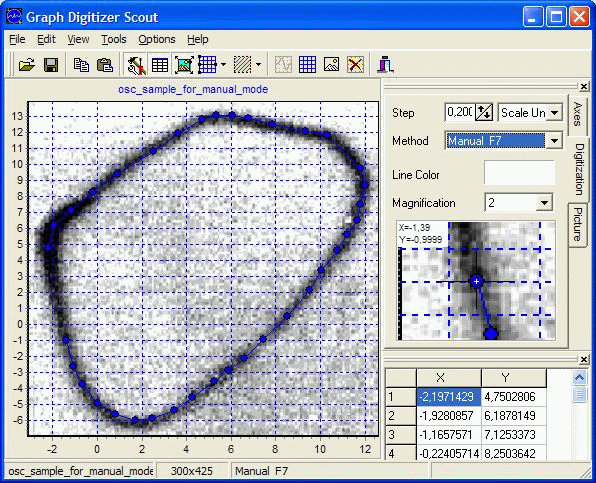
In this step-by-step tutorial we will learn how to digitize graph from a picture like this:
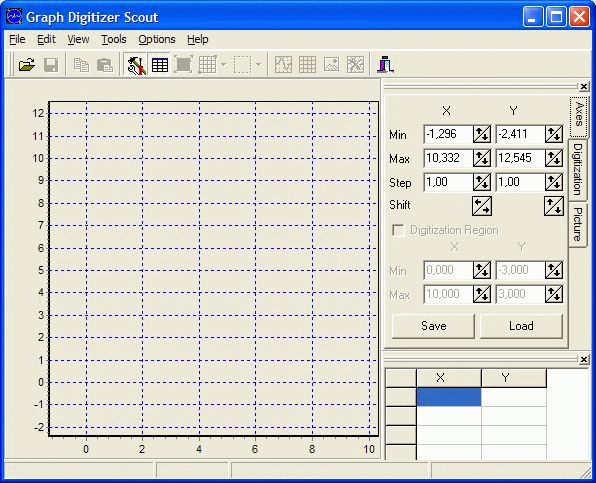
Run Graph Digitizer Scout:
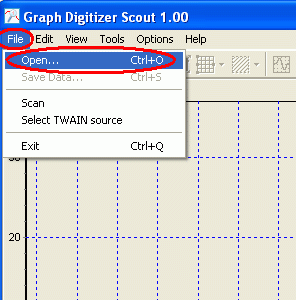
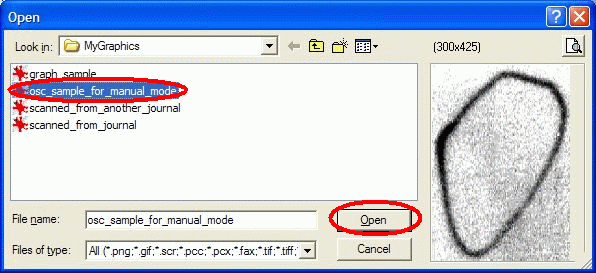
Open a a picture file:
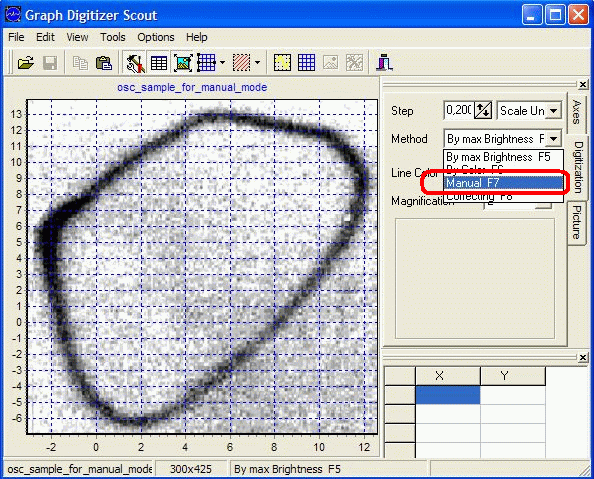
To digitize such a complex graph, it is better to use Manual Mode (press F7 to start Manual Mode mode)
As this graph contains points not sorted by X-axis, enable Not Sorted by X via Options | Preferences
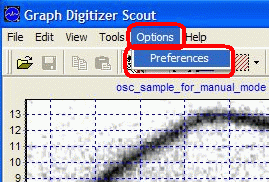
And then check Not Sorted by X option in the Options dialog :
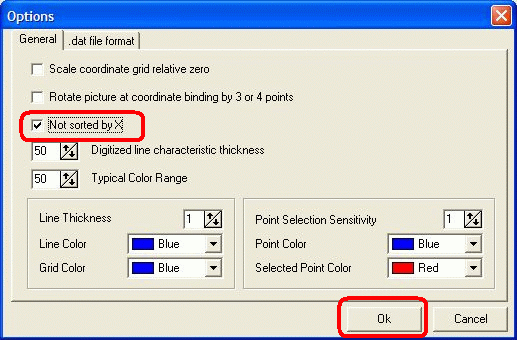
And click OK
Now change digitization mode to Manual by pressing F7 or by changing method on Digitization tab
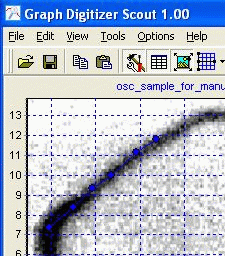
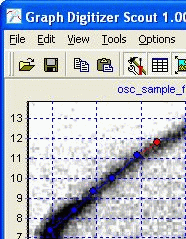
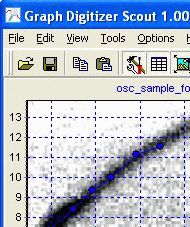
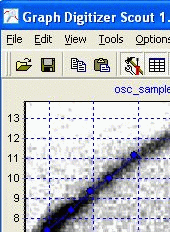
Now add points on the graph using left-button on your mouse:
To correct recently added point click on it using left mouse button and program will highlight selected point with red color:
Point is selected. To correct point and move it to another position please click another position and point will be moved to the new position:
To remove recently placed point click on the point with left mouse button:

to delete selected point press Delete or just right-click using your mouse
Add all other points according to the graph:
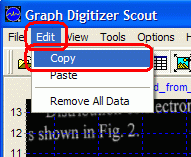
We can copy data to Excel via clipboard when we finished with all required points.
To copy data to the clipboard use Copy command in Edit menu
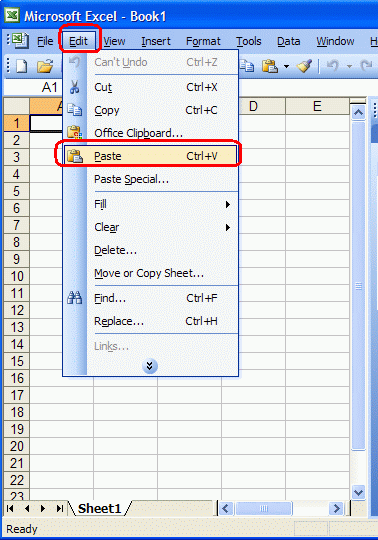
Then run Excel and use Paste command in Edit menu to insert points from clipboard:
Excel will paste points to A and B columns:
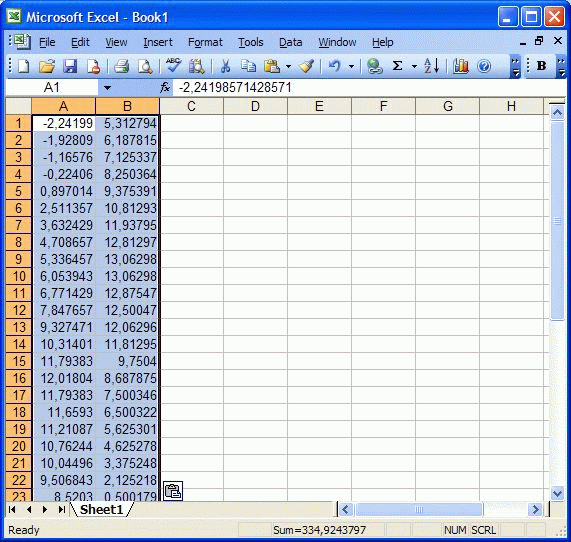
Now we can generate a chart using data in these columns where A column is X axis and B column is Y axis
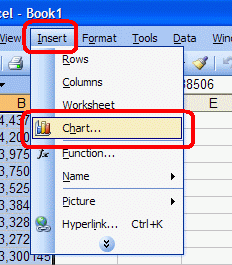
Go to Insert menu and use Chart command to generate a chart:
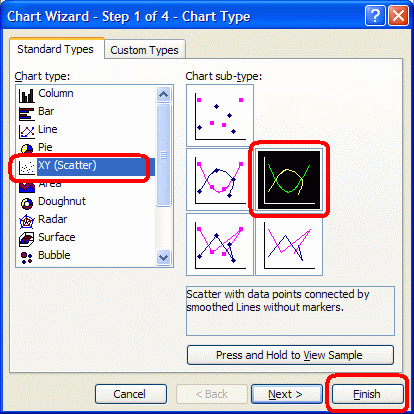
Set chart type and click Finish
Excel will generate new chart using points we copied from graph digitized using Graph Digitizer Scout
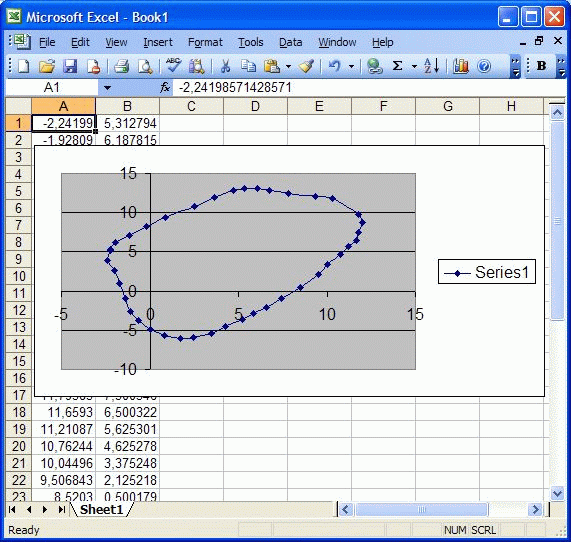
Everything’s done!